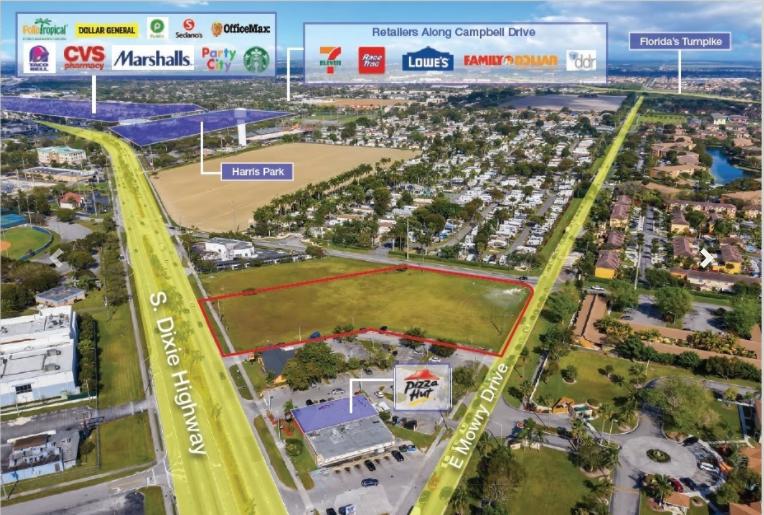
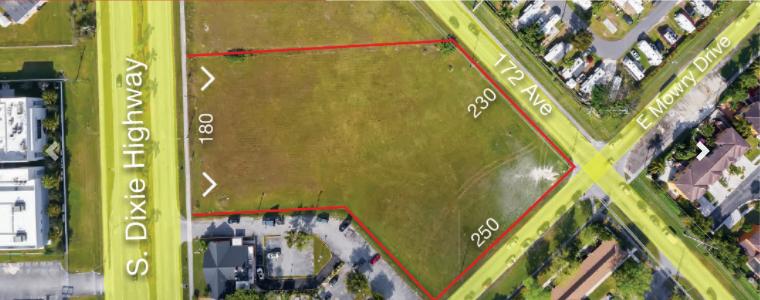
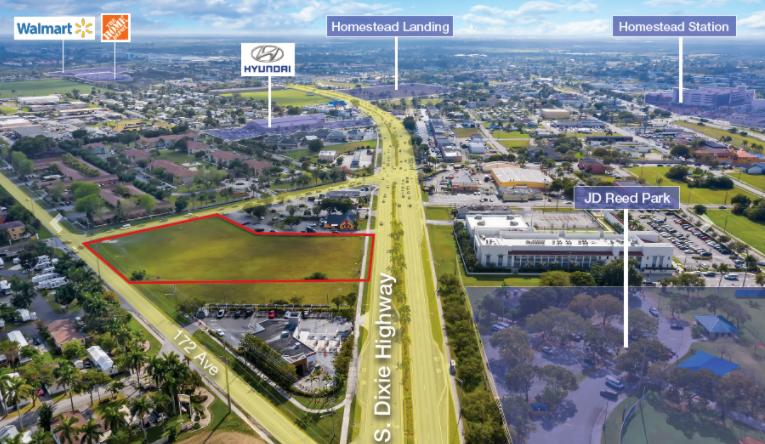
1-Mile | 3-Miles | 5-Miles | ||
---|---|---|---|---|
Total Population | 18,809 | 94,369 | 142,898 | |
Population Median Age | 32 | 33 | 33 | |
Population by Age | 0-9 Yrs | 3709 (19%) | 17611 (18%) | 25722 (18%) |
10-19 Yrs | 2418 (12%) | 14440 (15%) | 22450 (15%) | |
20-29 Yrs | 3060 (16%) | 13670 (14%) | 19706 (13%) | |
30-39 Yrs | 3239 (17%) | 14003 (14%) | 21473 (15%) | |
40-49 Yrs | 2177 (11%) | 12064 (12%) | 19061 (13%) | |
50-59 Yrs | 2159 (11%) | 10428 (11%) | 15625 (10%) | |
60-69 Yrs | 1088 (5%) | 6552 (6%) | 10647 (7%) | |
70+ Yrs | 960 (5%) | 5602 (5%) | 8214 (5%) | |
Median HH Income | $35,829 | $44,622 | $45,446 | |
Total Household Income | < 24K | 1704 (32%) | 6325 (25%) | 9530 (25%) |
25-49K | 1801 (34%) | 7335 (30%) | 10718 (28%) | |
50-74K | 958 (18%) | 4571 (18%) | 6870 (18%) | |
75-99K | 313 (5%) | 2448 (10%) | 4137 (11%) | |
100-199K | 364 (6%) | 3151 (12%) | 5004 (13%) | |
200K+ | 115 (2%) | 610 (2%) | 884 (2%) | |
Highest Education Level | No Diploma | 3778 | 17472 | 24388 |
Diploma or GED | 2937 | 15157 | 24069 | |
Some College | 1812 | 8767 | 13689 | |
Assoc. Degree | 942 | 5496 | 8299 | |
Bachelors Degree | 1362 | 6376 | 10520 | |
Higher Degree | 484 | 2842 | 4803 | |
Total Housing Units | 5,560 | 26,654 | 40,212 | |
--Owner-Occupied | 1,425 | 11,334 | 17,616 | |
--Renter-Occupied | 3,831 | 13,108 | 19,527 | |
Owner-Occupied Values | < 100K | 414 | 1501 | 2351 |
100-199K | 499 | 3446 | 4901 | |
200-299K | 331 | 3974 | 6067 | |
300-399K | 116 | 1578 | 2764 | |
400-499K | 65 | 510 | 894 | |
500K+ | 1 | 324 | 639 | |
Total Working Age Population | 13,515 | 67,388 | 102,570 | |
In Work Force | 9,219 | 44,060 | 66,279 | |
Not In Work Force | 4,296 | 23,327 | 36,291 | |
Workforce Employed | 8,671 | 40,443 | 60,898 | |
Workforce Unemployed | 492 | 3,441 | 5,127 | |
Civlian Workforce | 9,162 | 43,884 | 66,025 | |
Military Workforce | 57 | 176 | 253 | |
Total Households | 5,256 | 24,441 | 37,143 | |
Family Households | 4,061 | 19,726 | 30,082 | |
Non-Family Households | 1,195 | 4,715 | 7,061 | |
Married Couple | 2,078 | 10,886 | 16,310 | |
Other Family | 1,983 | 8,839 | 13,772 | |
Married w/Child | 1,139 | 5,710 | 8,388 | |
Single Male w/Child | 349 | 1,658 | 2,386 | |
Single Female w/Child | 826 | 3,316 | 5,749 |
Population Change Last Two Decades - Plus Projection
2000 | % | 2010 | % | 2020 | % | 2030 | |
---|---|---|---|---|---|---|---|
Florida | 15,982,378 | +18 | 18,801,310 | +14 | 21,517,610 | +13 | 24,340,457 |
Miami-Dade County | 2,253,362 | +11 | 2,496,435 | +15 | 2,861,579 | +11 | 3,190,242 |
Monroe County | 79,589 | -8 | 73,090 | +1 | 74,004 | 0 | 74,301 |
Total Working Age Population:
Total Households:
Total Working Age Population:
Total Households:
Total Working Age Population:
Total Households: