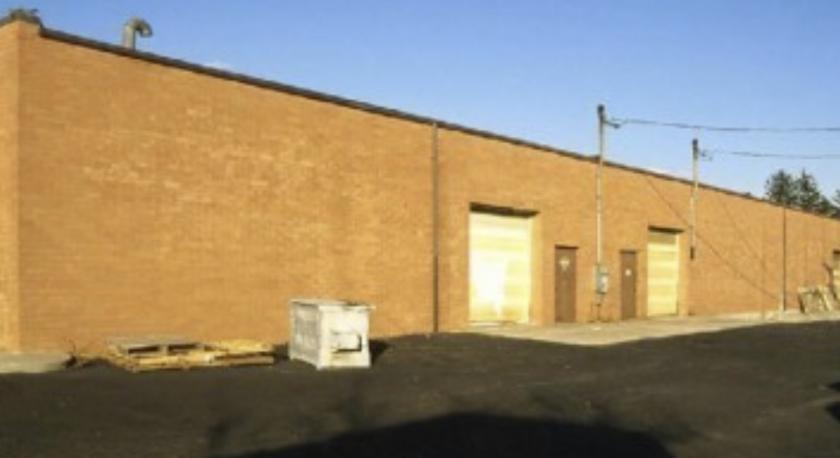
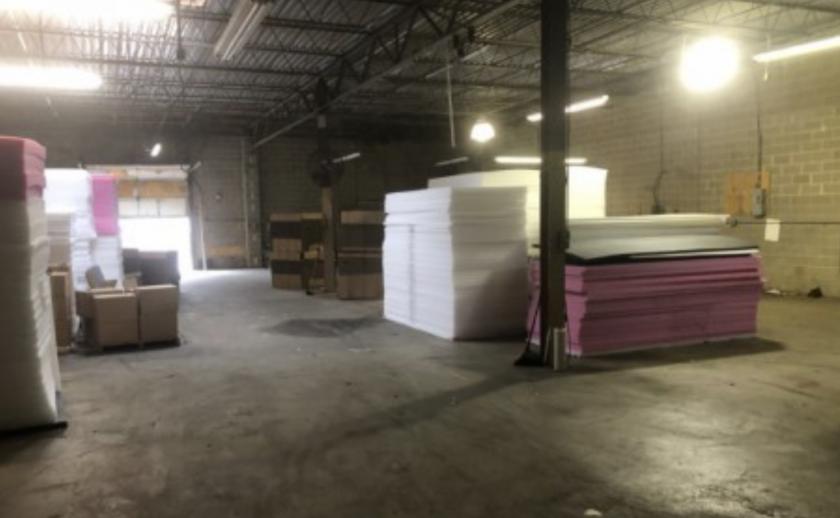
1-Mile | 3-Miles | 5-Miles | ||
---|---|---|---|---|
Total Population | 3,396 | 62,024 | 217,790 | |
Population Median Age | 39 | 40 | 40 | |
Population by Age | 0-9 Yrs | 378 (11%) | 6269 (10%) | 23196 (10%) |
10-19 Yrs | 479 (14%) | 8339 (13%) | 29433 (13%) | |
20-29 Yrs | 427 (12%) | 8249 (13%) | 27877 (12%) | |
30-39 Yrs | 519 (15%) | 7061 (11%) | 25097 (11%) | |
40-49 Yrs | 417 (12%) | 8639 (13%) | 31100 (14%) | |
50-59 Yrs | 468 (13%) | 9431 (15%) | 33750 (15%) | |
60-69 Yrs | 401 (11%) | 7327 (11%) | 24888 (11%) | |
70+ Yrs | 307 (9%) | 6707 (10%) | 22449 (10%) | |
Median HH Income | $101,737 | $100,963 | $101,915 | |
Total Household Income | < 24K | 101 (8%) | 1903 (9%) | 7512 (10%) |
25-49K | 176 (14%) | 2420 (11%) | 8585 (11%) | |
50-74K | 171 (14%) | 3034 (14%) | 9800 (13%) | |
75-99K | 136 (11%) | 2824 (13%) | 9753 (13%) | |
100-199K | 429 (36%) | 7586 (36%) | 25987 (35%) | |
200K+ | 172 (14%) | 2788 (13%) | 10920 (15%) | |
Highest Education Level | No Diploma | 185 | 2957 | 12111 |
Diploma or GED | 622 | 13966 | 43652 | |
Some College | 502 | 7993 | 28148 | |
Assoc. Degree | 261 | 4815 | 16112 | |
Bachelors Degree | 446 | 7744 | 28895 | |
Higher Degree | 298 | 5860 | 21988 | |
Total Housing Units | 1,234 | 21,837 | 79,388 | |
--Owner-Occupied | 920 | 16,067 | 56,667 | |
--Renter-Occupied | 266 | 4,489 | 15,889 | |
Owner-Occupied Values | < 100K | 4 | 626 | 1725 |
100-199K | 13 | 577 | 2256 | |
200-299K | 142 | 2431 | 8494 | |
300-399K | 298 | 6996 | 21170 | |
400-499K | 334 | 3883 | 14043 | |
500K+ | 129 | 1552 | 8979 | |
Total Working Age Population | 2,816 | 51,058 | 177,606 | |
In Work Force | 1,991 | 34,470 | 119,146 | |
Not In Work Force | 825 | 16,588 | 58,461 | |
Workforce Employed | 1,952 | 33,071 | 114,451 | |
Workforce Unemployed | 39 | 1,378 | 4,626 | |
Civlian Workforce | 1,991 | 34,449 | 119,078 | |
Military Workforce | 0 | 20 | 68 | |
Total Households | 1,187 | 20,555 | 72,556 | |
Family Households | 836 | 15,007 | 53,227 | |
Non-Family Households | 351 | 5,549 | 19,329 | |
Married Couple | 668 | 11,741 | 41,060 | |
Other Family | 168 | 3,265 | 12,167 | |
Married w/Child | 292 | 4,997 | 17,490 | |
Single Male w/Child | 9 | 206 | 997 | |
Single Female w/Child | 48 | 968 | 3,682 |
Population Change Last Two Decades - Plus Projection
2000 | % | 2010 | % | 2020 | % | 2030 | |
---|---|---|---|---|---|---|---|
New York | 18,976,457 | +2 | 19,378,102 | +4 | 20,146,131 | +2 | 20,604,030 |
Suffolk County | 1,419,369 | +5 | 1,493,350 | 0 | 1,497,391 | -1 | 1,488,885 |
Total Working Age Population:
Total Households:
Total Working Age Population:
Total Households:
Total Working Age Population:
Total Households: