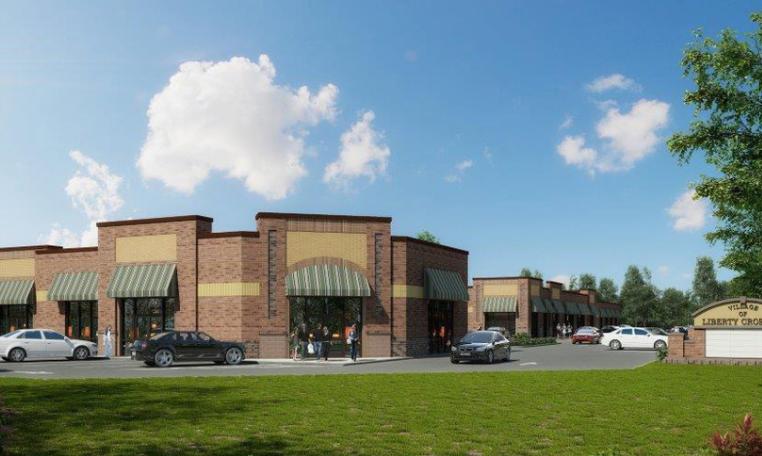
Fully approved commercial / industrial site for immediate development.
Highlights
• Fully approved commercial site for immediate development
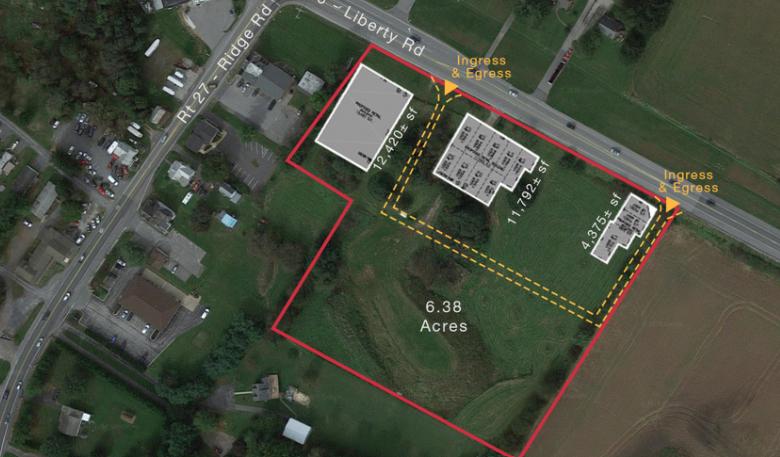
• Major intersection of Routes 27 & 26
• Site Plan approved for:
- 28,587 sf of commercial office and retail
- 56,333 sf of self storage
• Zoned B-G (General Business District)
• All engineering conveys
• Development can be phased
No part of this information may be copied, reproduced, repurposed, or screen-captured for any commercial purpose without prior written authorization from MyEListing.
While we strive to provide the most accurate information, all listing information, and demographic data, is provided by third-parties. As such, MyEListing will not be responsible for the accuracy of the information. It is strongly recommended that you verify all information with the listing agent, and any relevant agencies, prior to making any decisions.
What is the building size of this Retail property in Westminster, MD?
The size of the building/unit at 2525 West Liberty Road in Westminster is 84,920 square feet
How much land does the Westminster, MD property at 2525 West Liberty Road include?
2525 West Liberty Road in Westminster includes 6.680 acres of land
What kind of Retail is the propery at 2525 West Liberty Road?
The property at 2525 West Liberty Road Westminster, MD 21157 is listed as a Free Standing Building Retail property
What is the population within 1 mile of 2525 West Liberty Road in Westminster?
The population within 1 mile of 2525 West Liberty Road Westminster, MD 21157 is 896 people.
Who do I contact for questions about 2525 West Liberty Road?
You should contact the listing agent,
Barbara Richman Khan, for any details regarding this commercial listing.