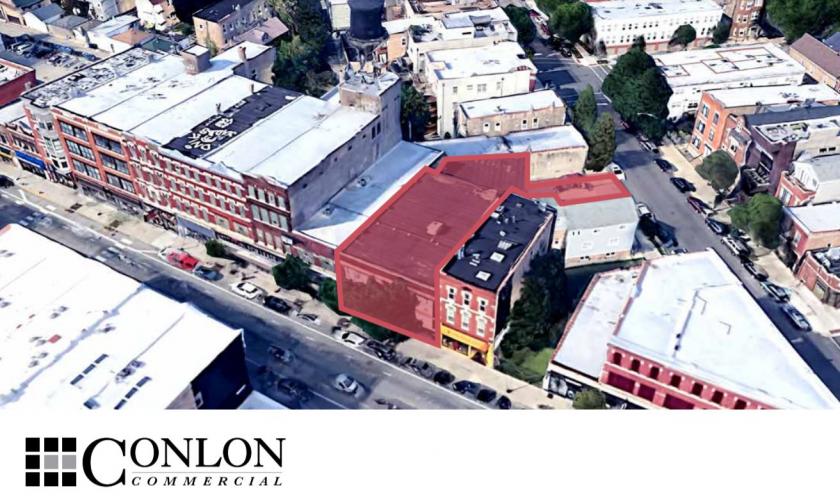
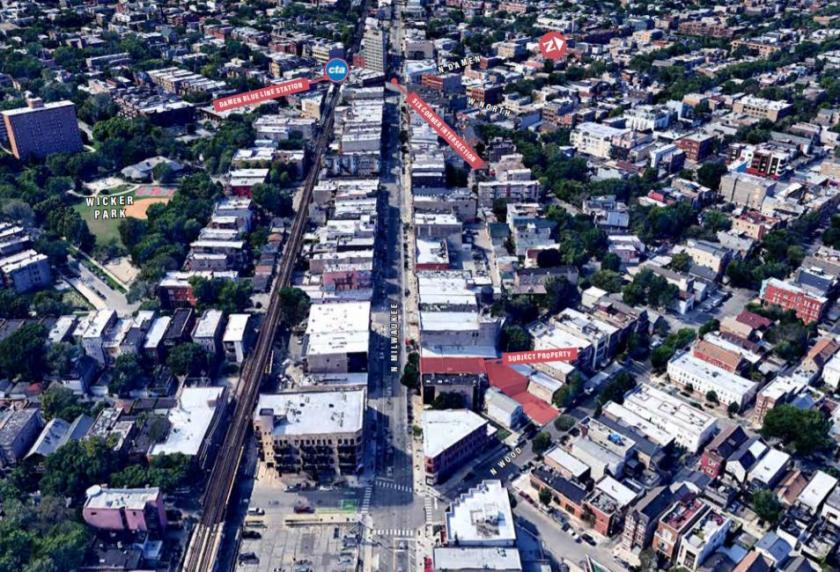
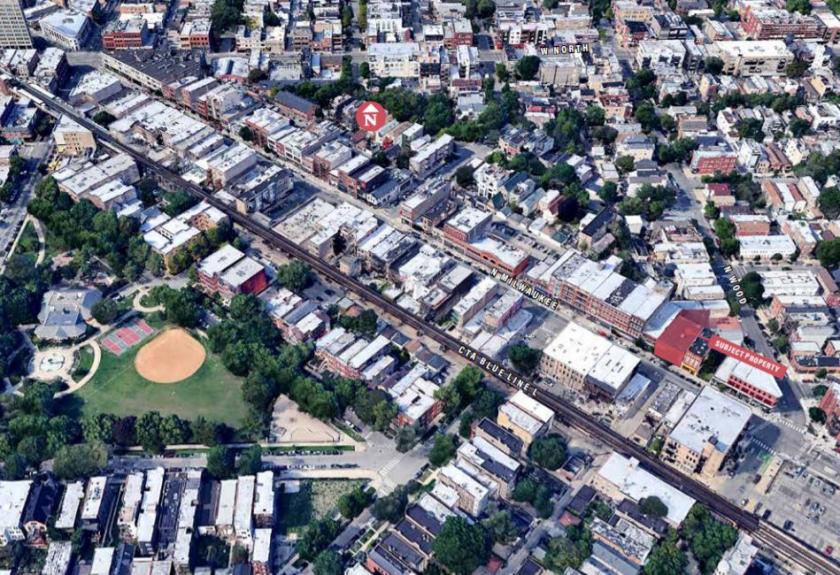
Fantastic building located in the heart of the vibrant Wicker Park and Bucktown neighborhoods with many national retailers, restaurants, bars and local shops. Just steps from the 606 Trail and the six-corners intersection of North, Damen, and Milwaukee Avenue.
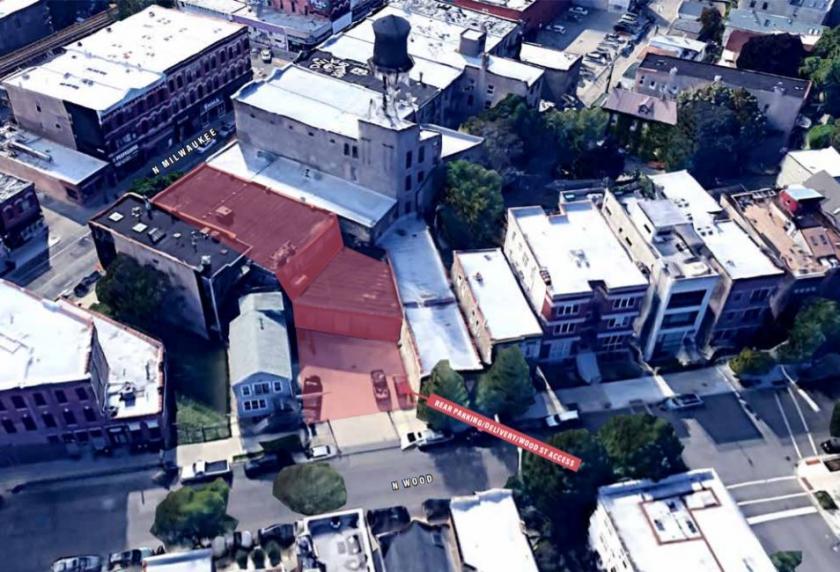
Two story retail/office building has loading access on Wood Street and offstreet parking at the rear of the property with two grade level 9 ft x 10 ft dock doors. Includes full, clean and dry basement with 8 ft clear ceiling height.
Building is currently vacant and available for lease
Building has 50’ frontage on Milwaukee Avenue and also wraps around with frontage on Wood Street
Zoned B3-2 which allows for retail, residential, hospitality, office, mixed-use and many other possible development plans.
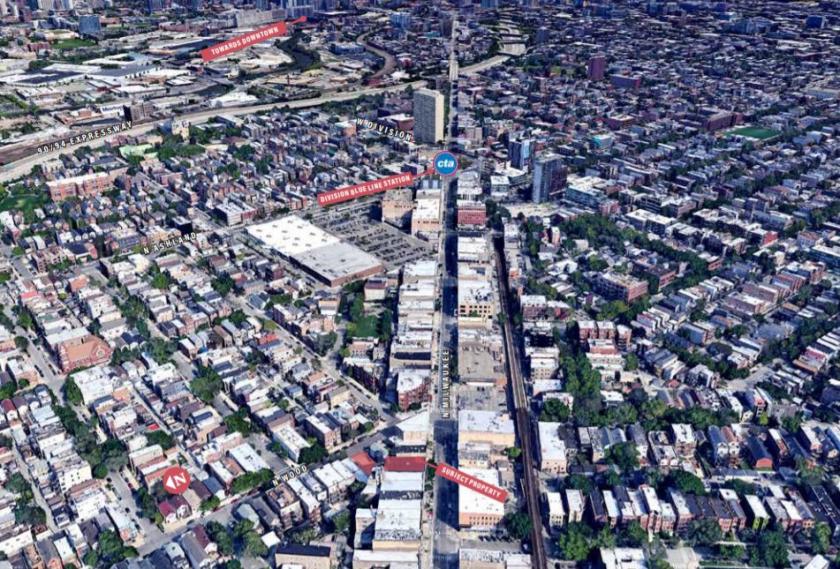
The Damen CTA Blue Line stop is ¼ mile away and there are numerous bus lines and defined bike lanes nearby on both Damen and Milwaukee Avenue. The property may qualify as a “transit-oriented development” site, with potential to obtain beneficial zoning bonuses offered by the City
No part of this information may be copied, reproduced, repurposed, or screen-captured for any commercial purpose without prior written authorization from MyEListing.
While we strive to provide the most accurate information, all listing information, and demographic data, is provided by third-parties. As such, MyEListing will not be responsible for the accuracy of the information. It is strongly recommended that you verify all information with the listing agent, and any relevant agencies, prior to making any decisions.
What is the building size of this commercial Office property?
The size of this lease property at '.1417 North Milwaukee Avenue.' is 10000 square feet
What is the population within 1 mile of 1417 North Milwaukee Avenue in Libertyville?
The population within 1 mile of 1417 North Milwaukee Avenue Libertyville, IL 60048 is 6,012 people.
Who do I contact for questions about 1417 North Milwaukee Avenue?
You should contact the listing agent,
Steve Horvath, for any details regarding this commercial listing.