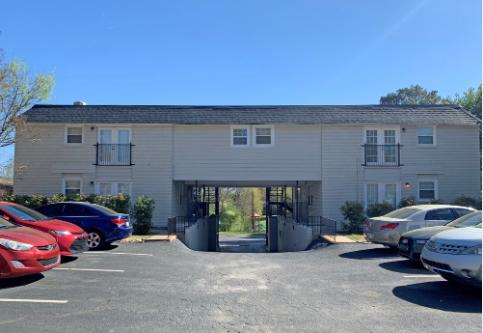
Multifamily Housing
135 Oakwood Avenue Spartanburg, SC 29302
135 Oakwood Avenue Spartanburg, SC 29302
Details & Description
Property Highlights
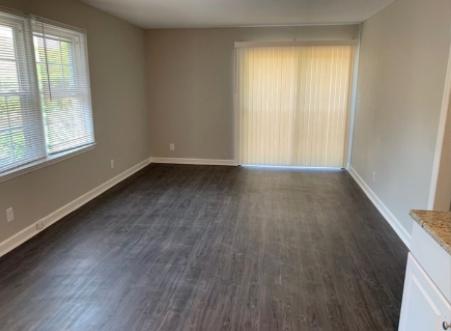
- • All units are 2 bed1 bath
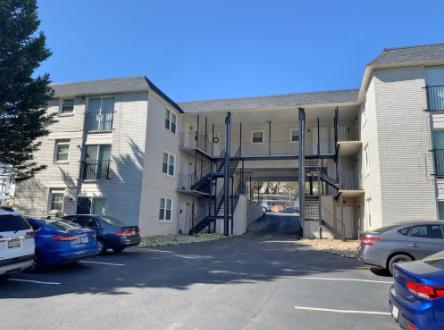
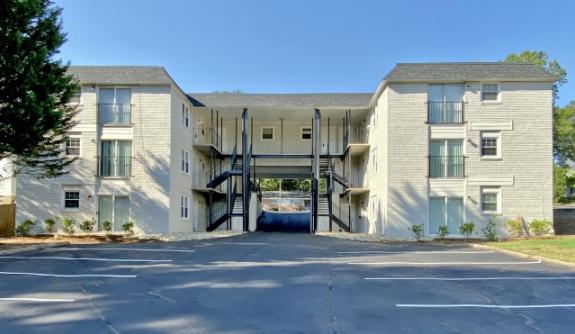
- • Exterior fully renovated
- • New roof 2019
- • 5 Units have been completely remodeled
- • Ample parking
Additional Photos

Listing Agents

Chandler Ayers
O: 864-678-5970
cayers@naiearlefurman.com
O: 864-678-5970
cayers@naiearlefurman.com
While we strive to provide the most accurate information, all listing information, and demographic data, is provided by third-parties. As such, MyEListing will not be responsible for the accuracy of the information. It is strongly recommended that you verify all information with the listing agent, and any relevant agencies, prior to making any decisions.


