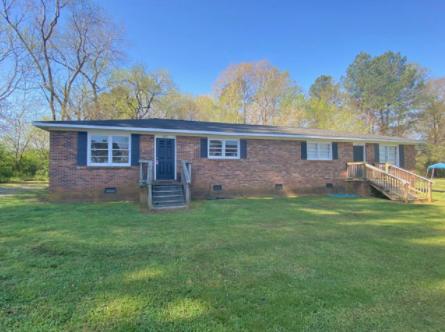
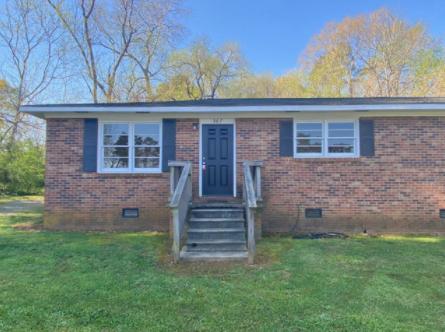
Multifamily Housing
394 Sequoia Drive Spartanburg, SC 29306
394 Sequoia Drive Spartanburg, SC 29306
Details & Description
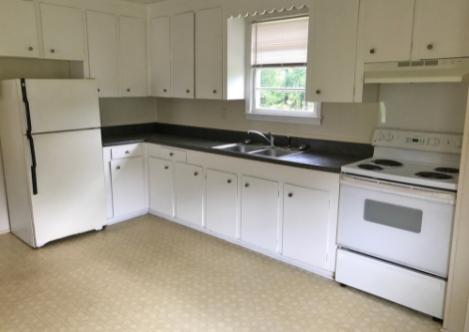
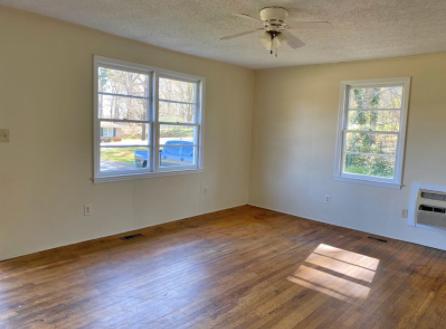
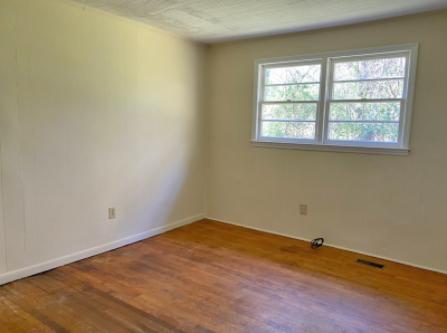
Property Highlights
- • 356 Sequoia Drive
- • 367 Sequoia Drive
- • 394 Sequoia Drive
- • All units are 2 bed1 bath
- • Will be 100 occupied as of May 1st
Additional Photos
Listing Agents

Chandler Ayers
O: 864-678-5970
cayers@naiearlefurman.com
O: 864-678-5970
cayers@naiearlefurman.com
While we strive to provide the most accurate information, all listing information, and demographic data, is provided by third-parties. As such, MyEListing will not be responsible for the accuracy of the information. It is strongly recommended that you verify all information with the listing agent, and any relevant agencies, prior to making any decisions.


