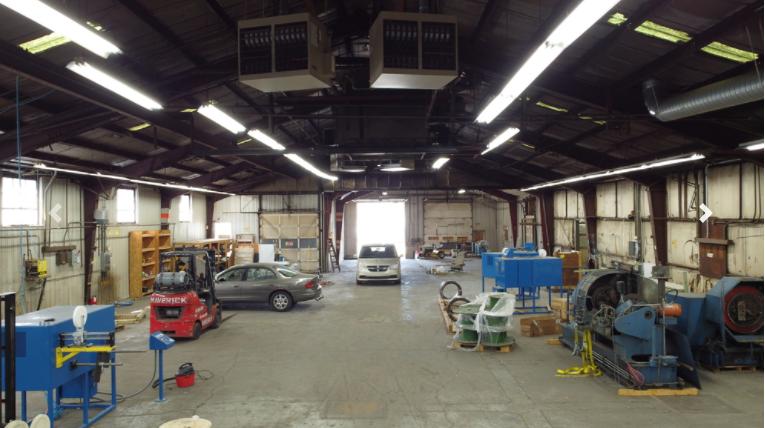
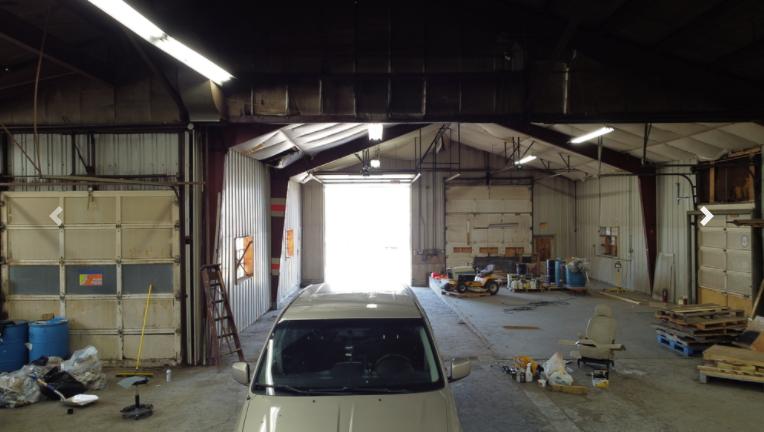
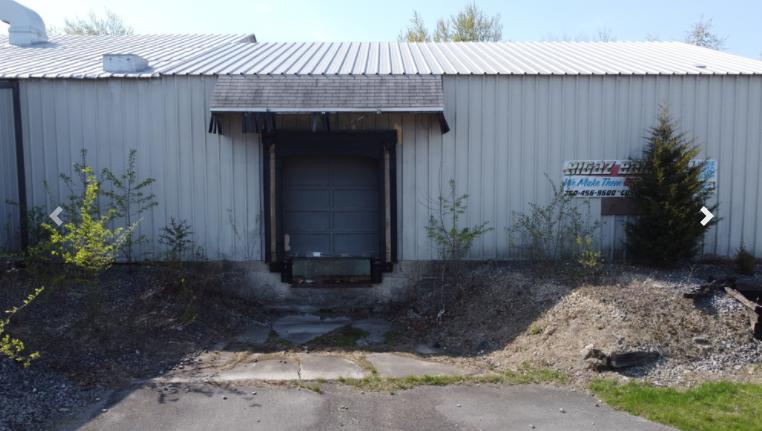
1-Mile | 3-Miles | 5-Miles | ||
---|---|---|---|---|
Total Population | 7,401 | 82,033 | 176,789 | |
Population Median Age | 32 | 34 | 36 | |
Population by Age | 0-9 Yrs | 1301 (17%) | 13324 (16%) | 27121 (15%) |
10-19 Yrs | 1496 (20%) | 13129 (16%) | 24792 (14%) | |
20-29 Yrs | 1020 (13%) | 13542 (16%) | 28665 (16%) | |
30-39 Yrs | 965 (13%) | 10767 (13%) | 22783 (12%) | |
40-49 Yrs | 831 (11%) | 9382 (11%) | 20738 (11%) | |
50-59 Yrs | 851 (11%) | 8863 (10%) | 20365 (11%) | |
60-69 Yrs | 486 (6%) | 7015 (8%) | 17274 (9%) | |
70+ Yrs | 449 (6%) | 6012 (7%) | 15050 (8%) | |
Median HH Income | $27,287 | $36,493 | $42,045 | |
Total Household Income | < 24K | 1244 (46%) | 10844 (34%) | 19570 (27%) |
25-49K | 768 (28%) | 9495 (30%) | 21525 (30%) | |
50-74K | 393 (14%) | 5260 (16%) | 13412 (19%) | |
75-99K | 163 (6%) | 2870 (9%) | 7975 (11%) | |
100-199K | 57 (2%) | 2274 (7%) | 6736 (9%) | |
200K+ | 35 (1%) | 394 (1%) | 891 (1%) | |
Highest Education Level | No Diploma | 1061 | 9923 | 16436 |
Diploma or GED | 1435 | 15876 | 35376 | |
Some College | 942 | 10135 | 25005 | |
Assoc. Degree | 346 | 4312 | 10901 | |
Bachelors Degree | 306 | 5976 | 15985 | |
Higher Degree | 50 | 2678 | 7016 | |
Total Housing Units | 3,176 | 36,880 | 79,127 | |
--Owner-Occupied | 1,232 | 16,150 | 39,656 | |
--Renter-Occupied | 1,429 | 14,987 | 30,451 | |
Owner-Occupied Values | < 100K | 1186 | 11879 | 23290 |
100-199K | 24 | 3596 | 14019 | |
200-299K | 17 | 415 | 1615 | |
300-399K | 0 | 82 | 331 | |
400-499K | 0 | 64 | 155 | |
500K+ | 4 | 113 | 247 | |
Total Working Age Population | 5,224 | 60,507 | 134,477 | |
In Work Force | 3,043 | 37,860 | 88,119 | |
Not In Work Force | 2,181 | 22,646 | 46,359 | |
Workforce Employed | 2,652 | 34,621 | 82,055 | |
Workforce Unemployed | 391 | 3,239 | 6,045 | |
Civlian Workforce | 3,043 | 37,860 | 88,100 | |
Military Workforce | 0 | 0 | 19 | |
Total Households | 2,661 | 31,137 | 70,107 | |
Family Households | 1,661 | 18,253 | 40,840 | |
Non-Family Households | 1,000 | 12,884 | 29,268 | |
Married Couple | 706 | 9,629 | 24,995 | |
Other Family | 955 | 8,624 | 15,845 | |
Married w/Child | 370 | 4,451 | 10,525 | |
Single Male w/Child | 61 | 1,107 | 2,414 | |
Single Female w/Child | 551 | 4,540 | 7,641 |
Population Change Last Two Decades - Plus Projection
2000 | % | 2010 | % | 2020 | % | 2030 | |
---|---|---|---|---|---|---|---|
Indiana | 6,080,485 | +7 | 6,483,802 | +4 | 6,738,573 | +4 | 7,014,880 |
Allen County | 331,849 | +7 | 355,329 | +7 | 379,671 | +6 | 402,948 |
Total Working Age Population:
Total Households:
Total Working Age Population:
Total Households:
Total Working Age Population:
Total Households: