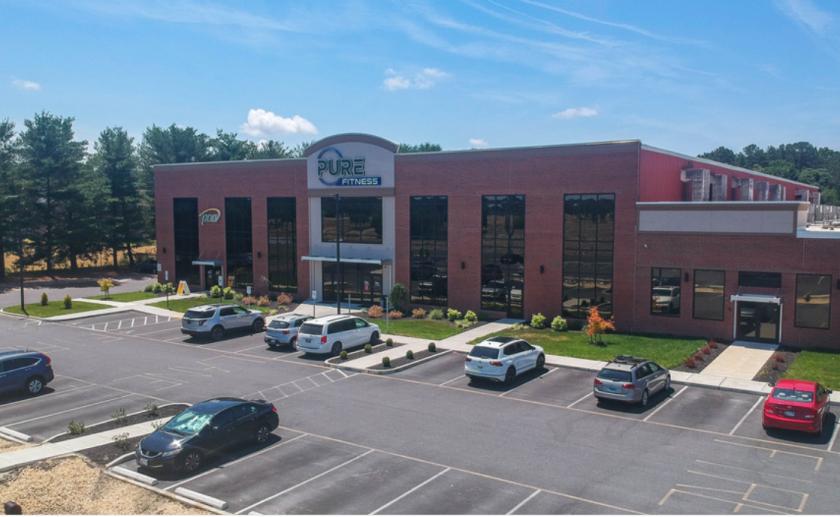
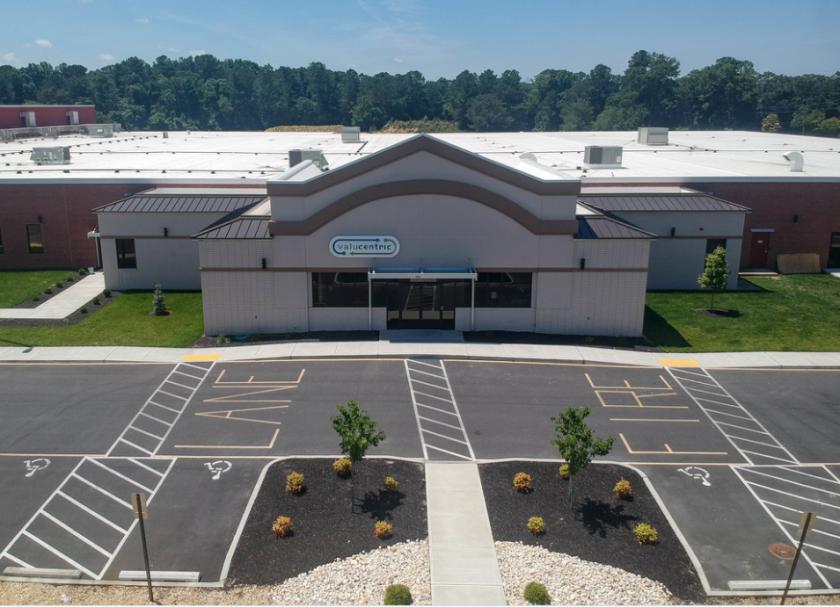
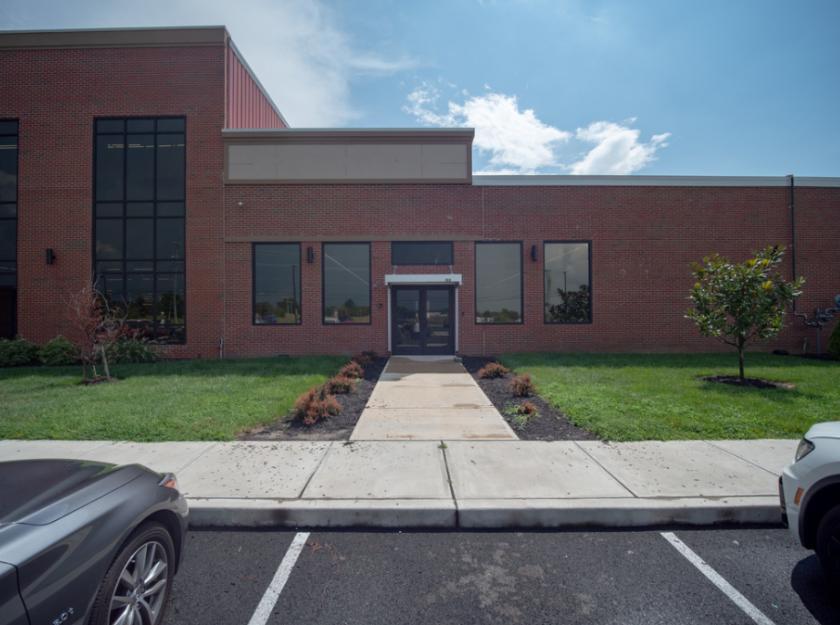
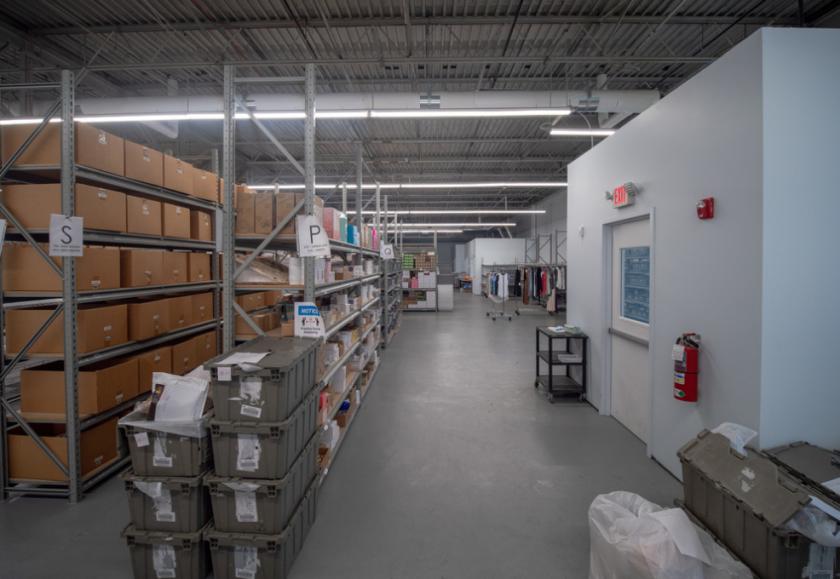
1-Mile | 3-Miles | 5-Miles | ||
---|---|---|---|---|
Total Population | 8,022 | 49,595 | 71,951 | |
Population Median Age | 38 | 36 | 37 | |
Population by Age | 0-9 Yrs | 1056 (13%) | 5760 (11%) | 8416 (11%) |
10-19 Yrs | 887 (11%) | 8501 (17%) | 11772 (16%) | |
20-29 Yrs | 1527 (19%) | 9408 (18%) | 12881 (17%) | |
30-39 Yrs | 937 (11%) | 5829 (11%) | 8140 (11%) | |
40-49 Yrs | 1078 (13%) | 5075 (10%) | 7635 (10%) | |
50-59 Yrs | 808 (10%) | 5128 (10%) | 8313 (11%) | |
60-69 Yrs | 854 (10%) | 4915 (9%) | 7484 (10%) | |
70+ Yrs | 876 (10%) | 4979 (10%) | 7310 (10%) | |
Median HH Income | $44,880 | $46,280 | $52,020 | |
Total Household Income | < 24K | 740 (22%) | 4796 (26%) | 6096 (22%) |
25-49K | 1163 (34%) | 5003 (27%) | 6820 (25%) | |
50-74K | 623 (18%) | 3608 (19%) | 5054 (18%) | |
75-99K | 363 (10%) | 1998 (10%) | 3064 (11%) | |
100-199K | 388 (11%) | 2579 (14%) | 4669 (17%) | |
200K+ | 54 (1%) | 409 (2%) | 907 (3%) | |
Highest Education Level | No Diploma | 737 | 4138 | 5955 |
Diploma or GED | 1564 | 9192 | 13031 | |
Some College | 901 | 5847 | 8594 | |
Assoc. Degree | 558 | 2223 | 3144 | |
Bachelors Degree | 795 | 4221 | 7112 | |
Higher Degree | 595 | 3271 | 5486 | |
Total Housing Units | 3,659 | 20,719 | 29,735 | |
--Owner-Occupied | 1,260 | 7,279 | 12,748 | |
--Renter-Occupied | 2,070 | 11,113 | 13,860 | |
Owner-Occupied Values | < 100K | 243 | 1241 | 1806 |
100-199K | 697 | 3816 | 5854 | |
200-299K | 259 | 1640 | 3401 | |
300-399K | 40 | 335 | 1091 | |
400-499K | 3 | 80 | 217 | |
500K+ | 18 | 167 | 380 | |
Total Working Age Population | 6,499 | 40,431 | 58,251 | |
In Work Force | 4,420 | 25,298 | 36,940 | |
Not In Work Force | 2,079 | 15,133 | 21,311 | |
Workforce Employed | 4,085 | 23,060 | 33,845 | |
Workforce Unemployed | 294 | 2,108 | 2,966 | |
Civlian Workforce | 4,379 | 25,169 | 36,811 | |
Military Workforce | 41 | 129 | 129 | |
Total Households | 3,331 | 18,393 | 26,608 | |
Family Households | 1,879 | 10,329 | 15,870 | |
Non-Family Households | 1,451 | 8,064 | 10,739 | |
Married Couple | 966 | 5,827 | 10,052 | |
Other Family | 914 | 4,502 | 5,817 | |
Married w/Child | 324 | 2,177 | 3,840 | |
Single Male w/Child | 150 | 589 | 717 | |
Single Female w/Child | 464 | 2,049 | 2,505 |
Population Change Last Two Decades - Plus Projection
2000 | % | 2010 | % | 2020 | % | 2030 | |
---|---|---|---|---|---|---|---|
Maryland | 5,296,486 | +9 | 5,773,552 | +6 | 6,141,900 | +6 | 6,518,750 |
Somerset County | 24,747 | +7 | 26,470 | +1 | 26,750 | +6 | 28,450 |
Wicomico County | 84,644 | +17 | 98,733 | +8 | 106,200 | +11 | 118,200 |
Worcester County | 46,543 | +11 | 51,454 | +3 | 53,100 | +9 | 57,950 |
Total Working Age Population:
Total Households:
Total Working Age Population:
Total Households:
Total Working Age Population:
Total Households: