Industrial Properties
2670 Leisczs Bridge Road Leesport, PA 19533
2670 Leisczs Bridge Road Leesport, PA 19533
Details & Description
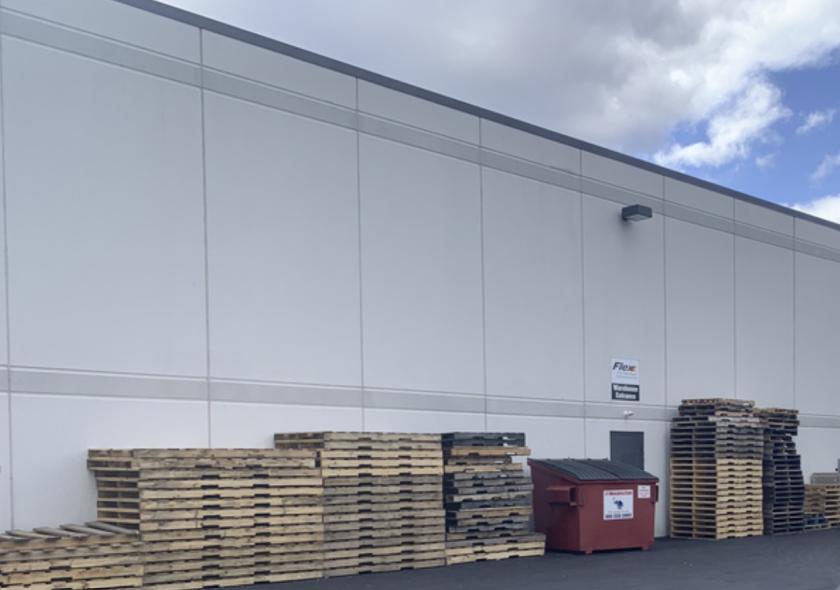
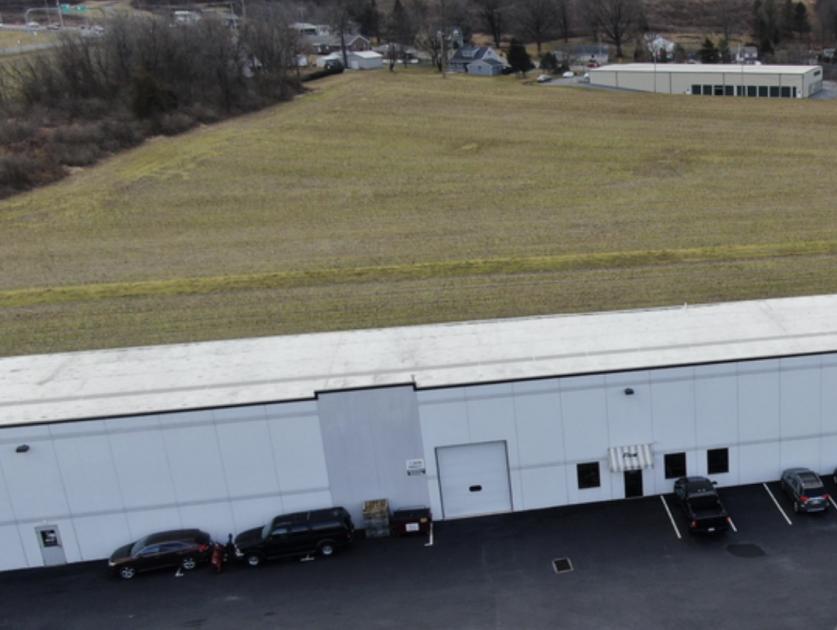
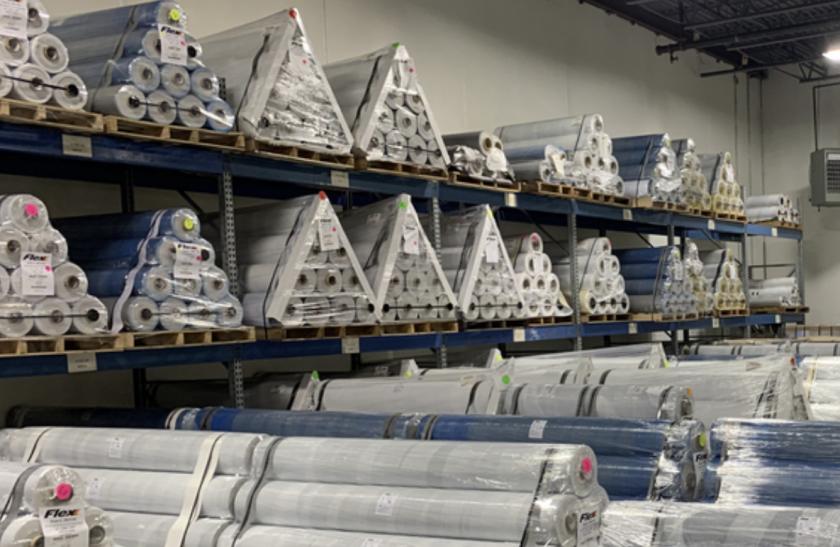
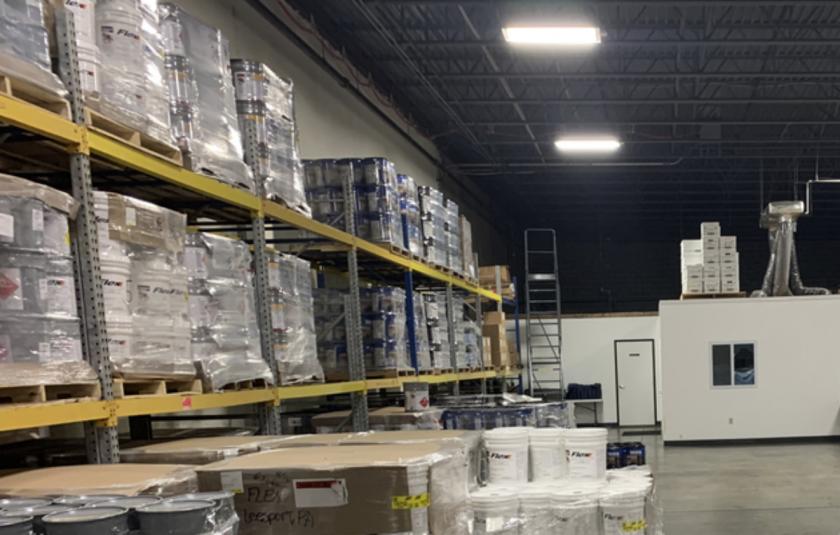
Additional Photos
Listing Agents

Bryan Cole
O: 610-779-1400
M: 610-209-9624
bcole@naikeystone.com
O: 610-779-1400
M: 610-209-9624
bcole@naikeystone.com

Patrick Zerbe
NAI Keystone
O: 610-370-8507
pzerbe@naikeystone.com
NAI Keystone
O: 610-370-8507
pzerbe@naikeystone.com
While we strive to provide the most accurate information, all listing information, and demographic data, is provided by third-parties. As such, MyEListing will not be responsible for the accuracy of the information. It is strongly recommended that you verify all information with the listing agent, and any relevant agencies, prior to making any decisions.


