Industrial Properties
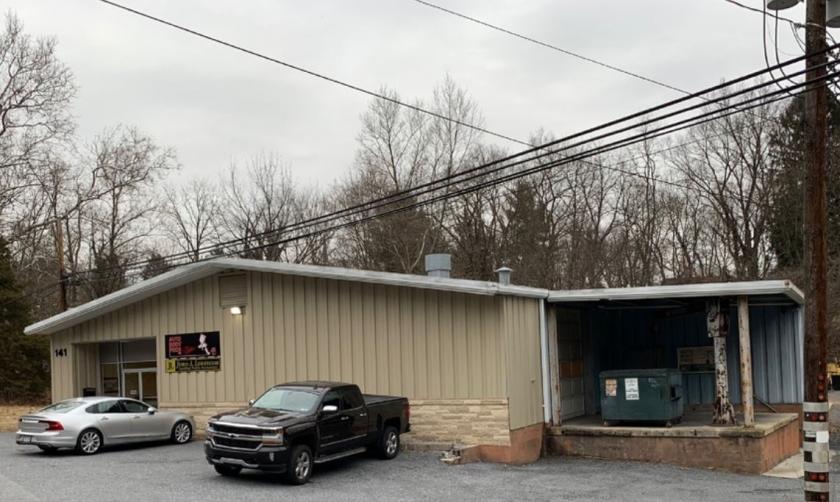
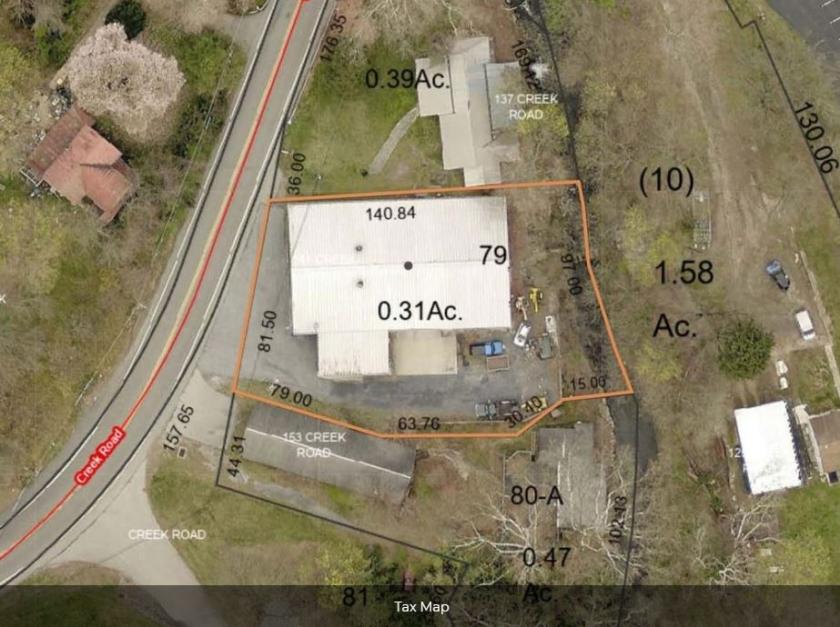
141 Creek Road Camp Hill, PA 17011
141 Creek Road Camp Hill, PA 17011
Details & Description
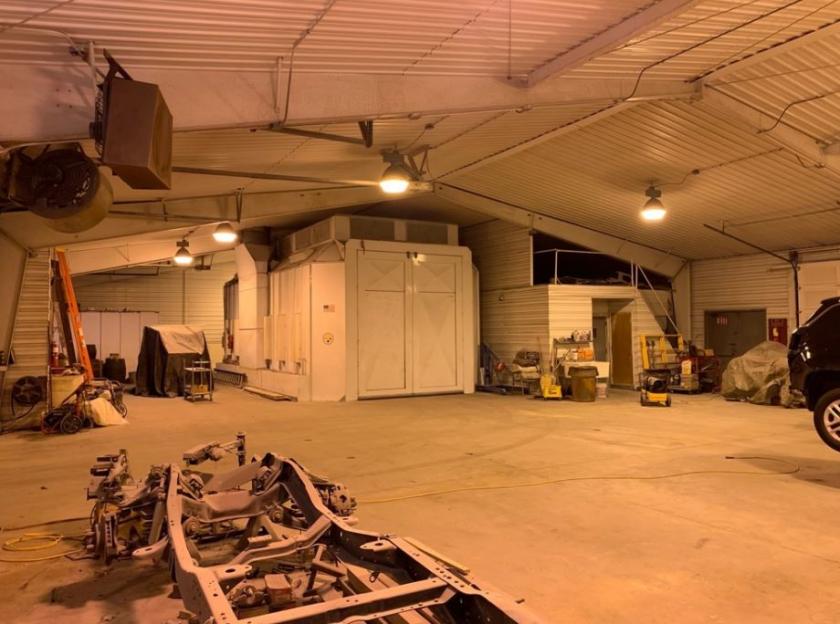
Additional Photos

Listing Agents

David Alderman
O: 717-761-5070
M: 717-460-8152
davidalderman@naicir.com
O: 717-761-5070
M: 717-460-8152
davidalderman@naicir.com
While we strive to provide the most accurate information, all listing information, and demographic data, is provided by third-parties. As such, MyEListing will not be responsible for the accuracy of the information. It is strongly recommended that you verify all information with the listing agent, and any relevant agencies, prior to making any decisions.


