Health Care and Medical Properties
1775 Lake Harley Drive Prince George, VA 23875
1775 Lake Harley Drive Prince George, VA 23875

Details & Description
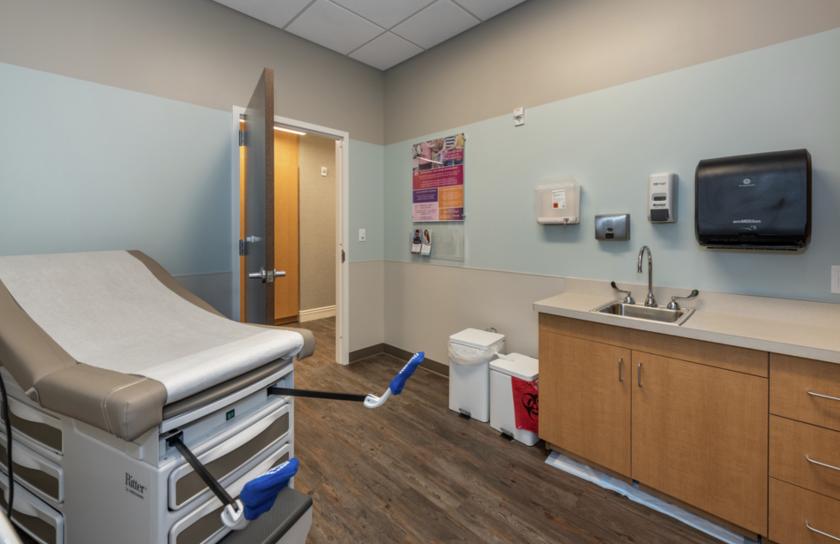
Additional Photos


Listing Agents

Christopher Rice
O: 804-513-6162
chrisrice@naidominion.com
O: 804-513-6162
chrisrice@naidominion.com

Cameron Maxey
O: 804-380-7254
cammaxey@naidominion.com
O: 804-380-7254
cammaxey@naidominion.com
While we strive to provide the most accurate information, all listing information, and demographic data, is provided by third-parties. As such, MyEListing will not be responsible for the accuracy of the information. It is strongly recommended that you verify all information with the listing agent, and any relevant agencies, prior to making any decisions.


