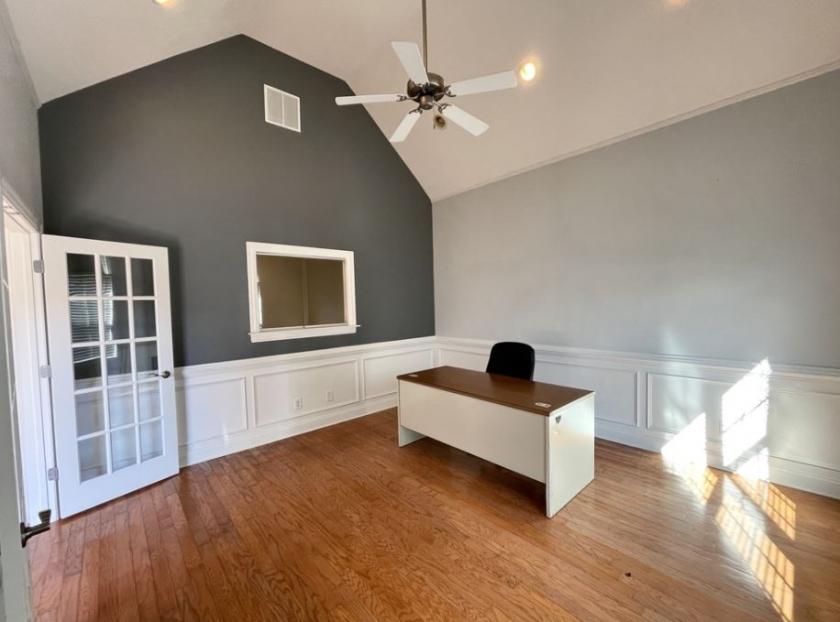
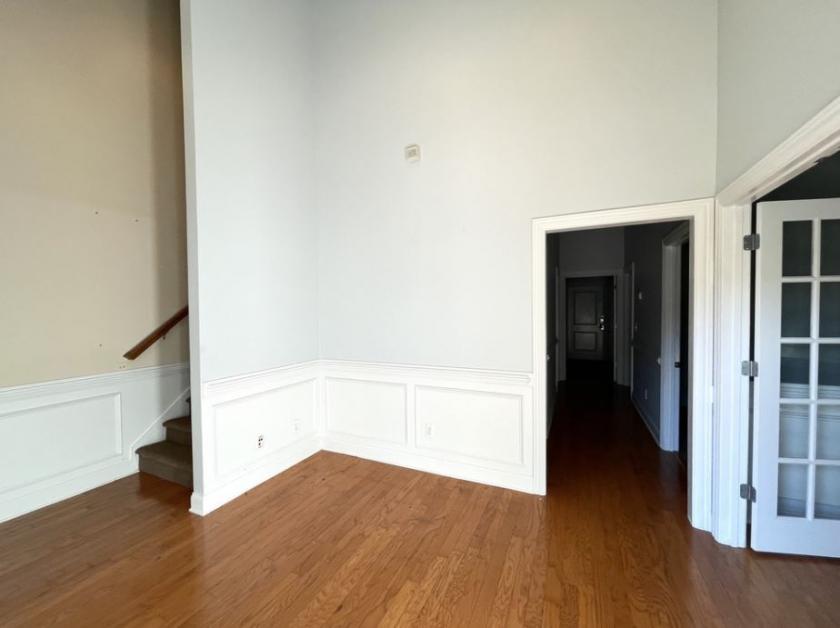
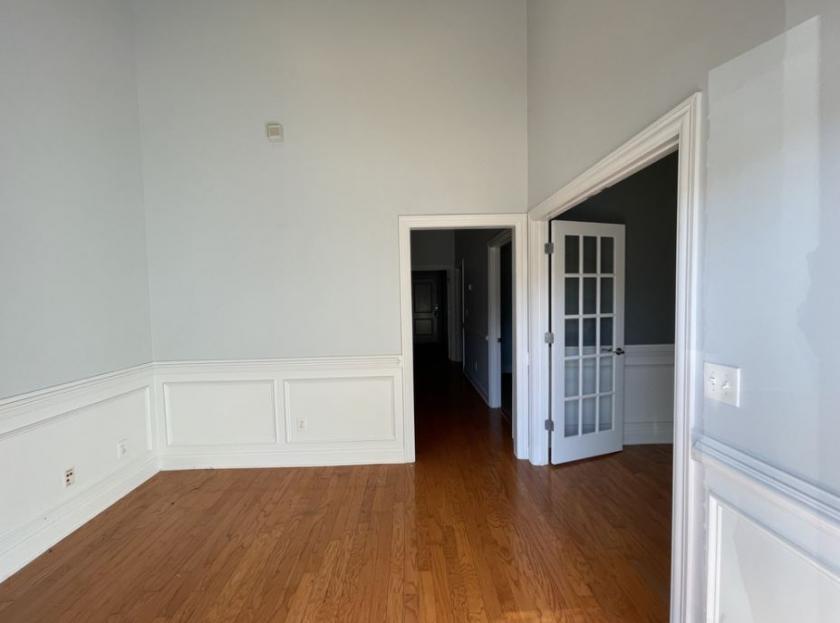
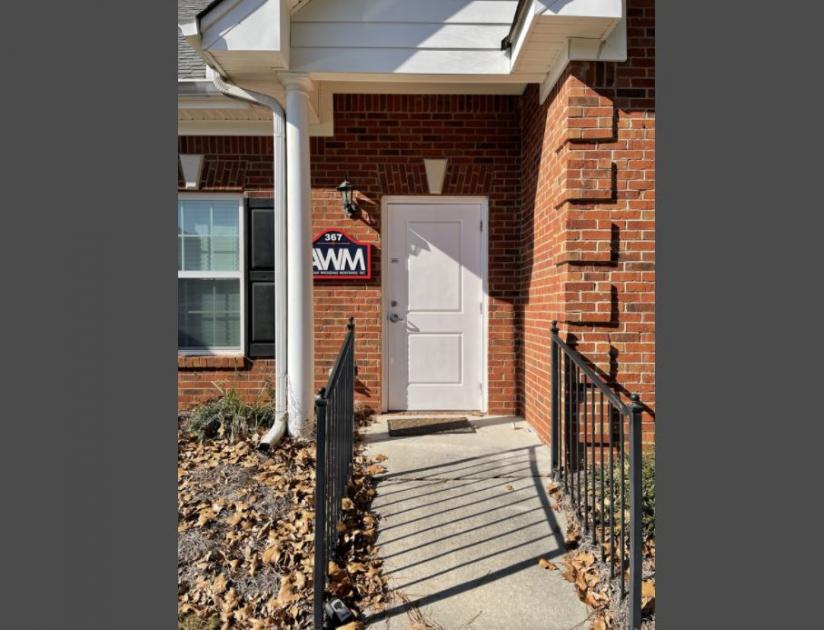
1-Mile | 3-Miles | 5-Miles | ||
---|---|---|---|---|
Total Population | 1,933 | 22,196 | 46,121 | |
Population Median Age | 35 | 35 | 36 | |
Population by Age | 0-9 Yrs | 293 (15%) | 3330 (15%) | 6827 (14%) |
10-19 Yrs | 227 (11%) | 3136 (14%) | 6653 (14%) | |
20-29 Yrs | 319 (16%) | 3174 (14%) | 6188 (13%) | |
30-39 Yrs | 354 (18%) | 3358 (15%) | 6914 (14%) | |
40-49 Yrs | 255 (13%) | 2983 (13%) | 6381 (13%) | |
50-59 Yrs | 163 (8%) | 2659 (11%) | 5780 (12%) | |
60-69 Yrs | 194 (10%) | 1972 (8%) | 4054 (8%) | |
70+ Yrs | 127 (6%) | 1583 (7%) | 3324 (7%) | |
Median HH Income | $60,650 | $55,781 | $58,934 | |
Total Household Income | < 24K | 99 (15%) | 1589 (21%) | 2767 (18%) |
25-49K | 149 (23%) | 1723 (23%) | 3592 (23%) | |
50-74K | 152 (23%) | 1499 (20%) | 3166 (20%) | |
75-99K | 122 (19%) | 1152 (15%) | 2535 (16%) | |
100-199K | 113 (17%) | 1285 (17%) | 2886 (19%) | |
200K+ | 3 (0%) | 97 (1%) | 225 (1%) | |
Highest Education Level | No Diploma | 247 | 2511 | 5030 |
Diploma or GED | 394 | 5038 | 10304 | |
Some College | 330 | 3429 | 7161 | |
Assoc. Degree | 81 | 1069 | 2318 | |
Bachelors Degree | 130 | 1513 | 3464 | |
Higher Degree | 107 | 874 | 1721 | |
Total Housing Units | 695 | 8,031 | 16,461 | |
--Owner-Occupied | 417 | 4,659 | 10,883 | |
--Renter-Occupied | 222 | 2,686 | 4,288 | |
Owner-Occupied Values | < 100K | 58 | 805 | 1628 |
100-199K | 253 | 2727 | 6605 | |
200-299K | 75 | 882 | 1879 | |
300-399K | 15 | 125 | 392 | |
400-499K | 0 | 35 | 180 | |
500K+ | 17 | 85 | 198 | |
Total Working Age Population | 1,497 | 16,848 | 35,080 | |
In Work Force | 1,019 | 11,347 | 23,069 | |
Not In Work Force | 477 | 5,501 | 12,011 | |
Workforce Employed | 959 | 10,768 | 21,825 | |
Workforce Unemployed | 61 | 579 | 1,239 | |
Civlian Workforce | 1,019 | 11,347 | 23,064 | |
Military Workforce | 0 | 0 | 5 | |
Total Households | 638 | 7,346 | 15,171 | |
Family Households | 487 | 5,270 | 11,184 | |
Non-Family Households | 152 | 2,076 | 3,987 | |
Married Couple | 272 | 3,482 | 8,043 | |
Other Family | 215 | 1,788 | 3,140 | |
Married w/Child | 128 | 1,618 | 3,779 | |
Single Male w/Child | 44 | 290 | 533 | |
Single Female w/Child | 57 | 577 | 1,052 |
Population Change Last Two Decades - Plus Projection
2000 | % | 2010 | % | 2020 | % | 2030 | |
---|---|---|---|---|---|---|---|
Georgia | 8,186,453 | +18 | 9,687,653 | +12 | 10,833,472 | +13 | 12,292,423 |
Barrow County | 46,144 | +50 | 69,367 | +25 | 86,383 | +35 | 116,916 |
Gwinnett County | 588,448 | +37 | 805,321 | +21 | 971,145 | +21 | 1,175,358 |
Jackson County | 41,589 | +45 | 60,485 | +24 | 74,700 | +28 | 95,493 |
Walton County | 60,687 | +38 | 83,768 | +14 | 95,814 | +14 | 109,179 |
Total Working Age Population:
Total Households:
Total Working Age Population:
Total Households:
Total Working Age Population:
Total Households: