Flex-Office-Warehouse
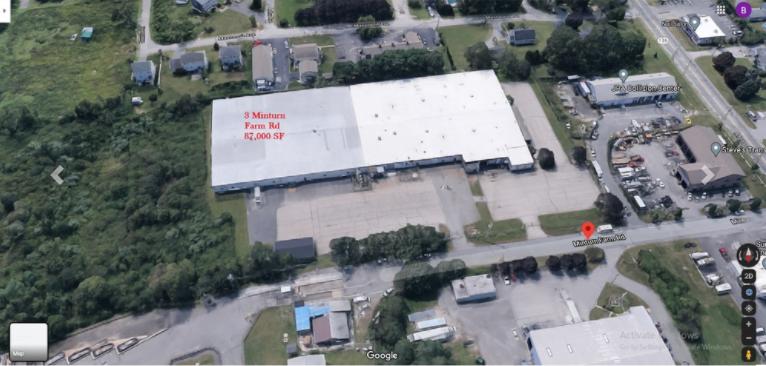
3 Minturn Farm Road Bristol, RI 02809
3 Minturn Farm Road Bristol, RI 02809
Details & Description
Property Highlights
- • Right of first refusal in place with current Ten
- • Tenant in place until 10-31-21
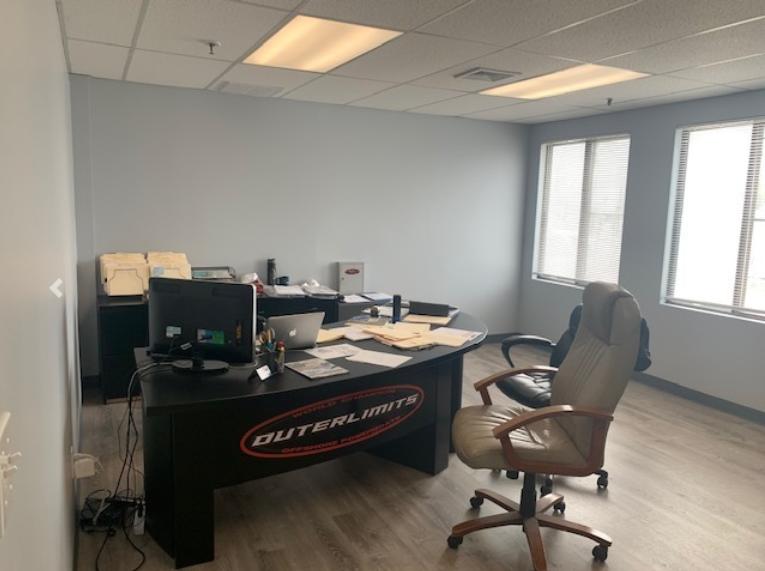
- • Large Scale Manufacturing Facility
- • East Bay Location
- • High-value infrastructure in place
Listing Agents

Brian Clark
O: 401-301-9002
bclark@naiadvisors.com
O: 401-301-9002
bclark@naiadvisors.com
While we strive to provide the most accurate information, all listing information, and demographic data, is provided by third-parties. As such, MyEListing will not be responsible for the accuracy of the information. It is strongly recommended that you verify all information with the listing agent, and any relevant agencies, prior to making any decisions.