Commercial Land
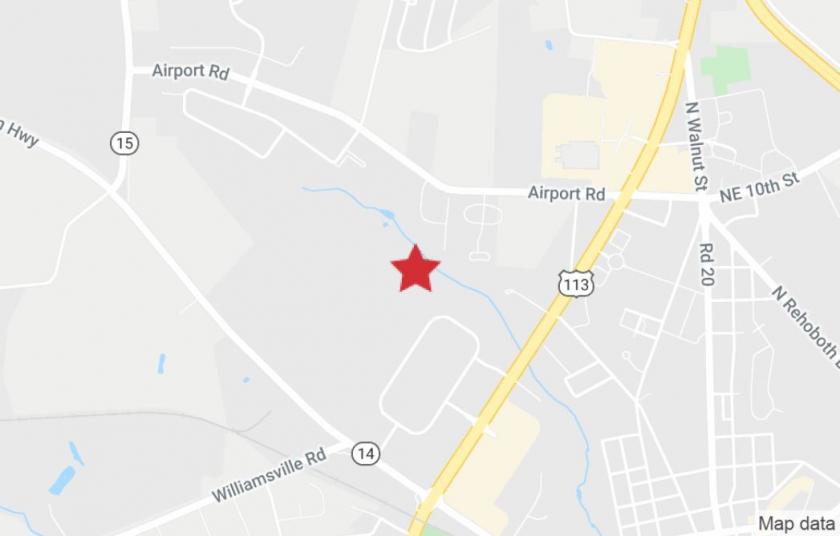
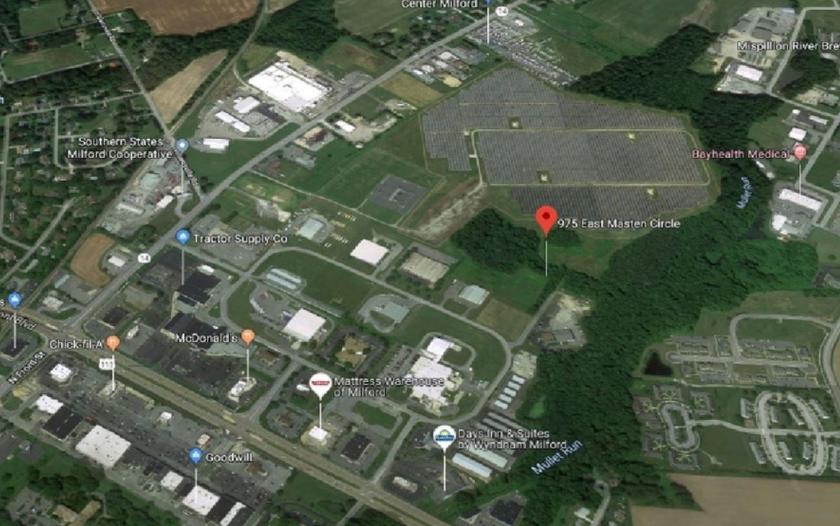
975 East Masten Circle Milford, DE 19963
975 East Masten Circle Milford, DE 19963

Details & Description
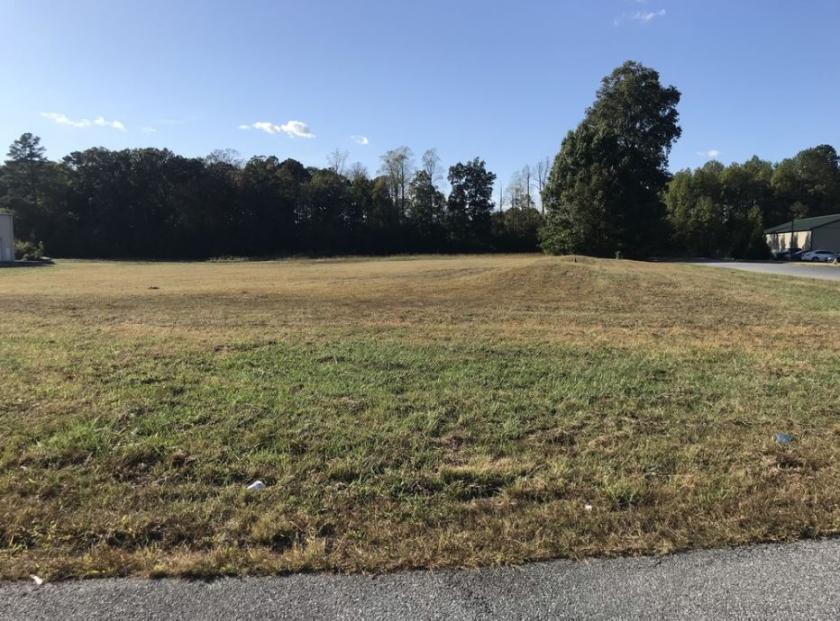
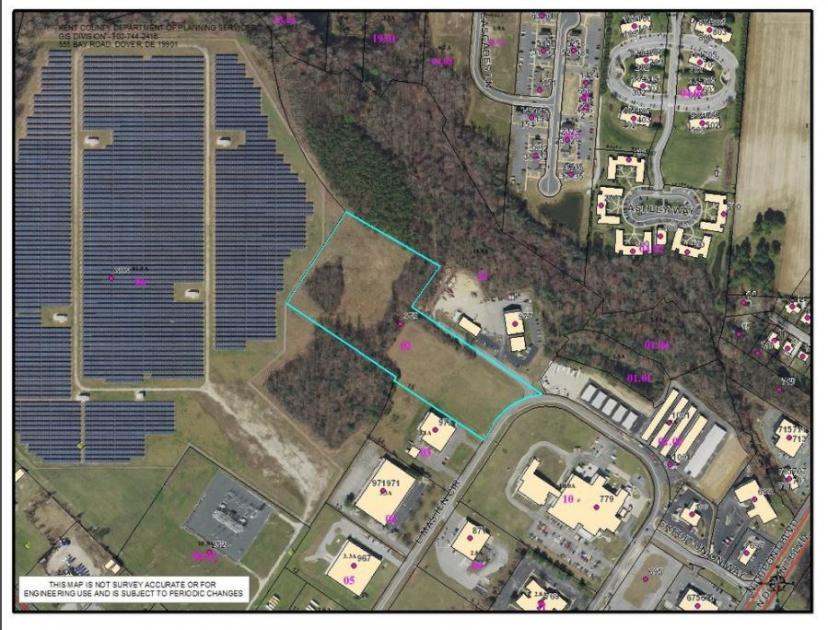
Additional Photos
Listing Agents

Lorraine Sheldon
O: 302-221-7211
M: 302-561-0385
lorrainesheldon@emoryhill.com
O: 302-221-7211
M: 302-561-0385
lorrainesheldon@emoryhill.com

Ann Bailey
O: 302-827-4940
M: 215-292-6100
annbailey@emoryhill.com
O: 302-827-4940
M: 215-292-6100
annbailey@emoryhill.com
While we strive to provide the most accurate information, all listing information, and demographic data, is provided by third-parties. As such, MyEListing will not be responsible for the accuracy of the information. It is strongly recommended that you verify all information with the listing agent, and any relevant agencies, prior to making any decisions.


