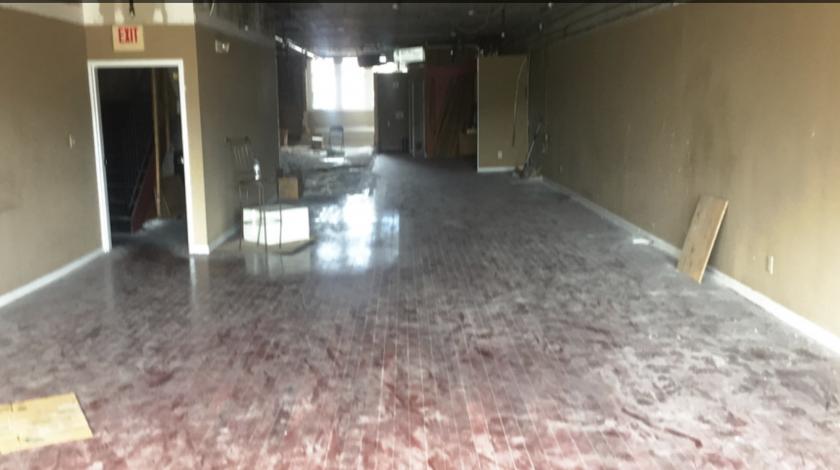
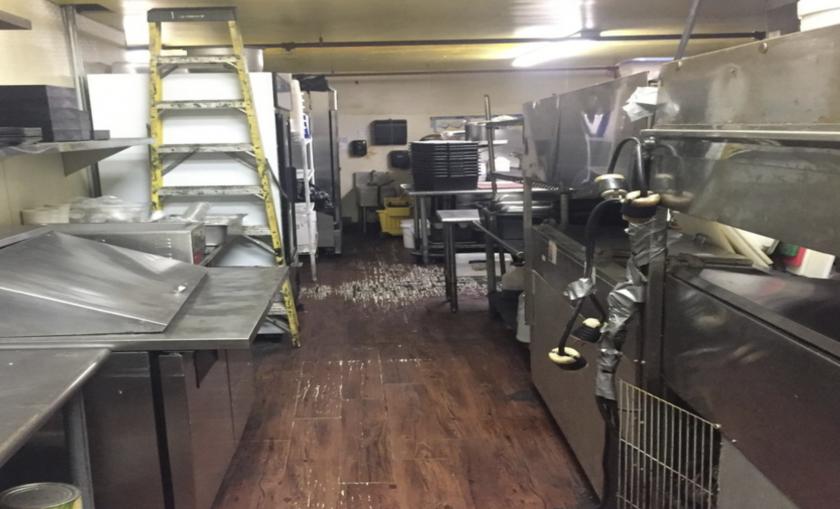
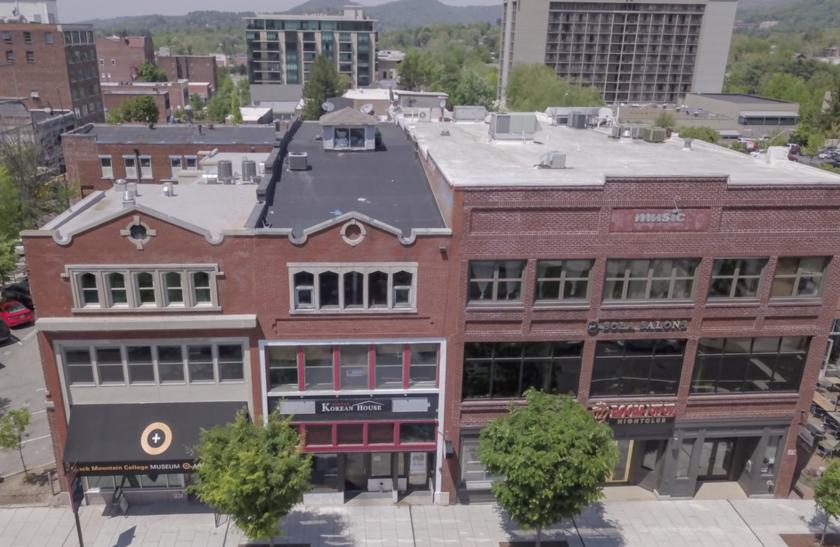
1-Mile | 3-Miles | 5-Miles | ||
---|---|---|---|---|
Total Population | 8,393 | 51,032 | 97,457 | |
Population Median Age | 41 | 40 | 40 | |
Population by Age | 0-9 Yrs | 647 (7%) | 4819 (9%) | 9854 (10%) |
10-19 Yrs | 540 (6%) | 5101 (9%) | 10065 (10%) | |
20-29 Yrs | 1522 (18%) | 8144 (15%) | 14389 (14%) | |
30-39 Yrs | 1713 (20%) | 9055 (17%) | 15912 (16%) | |
40-49 Yrs | 1066 (12%) | 6113 (11%) | 12494 (12%) | |
50-59 Yrs | 1089 (12%) | 6083 (11%) | 11326 (11%) | |
60-69 Yrs | 1108 (13%) | 6326 (12%) | 11983 (12%) | |
70+ Yrs | 708 (8%) | 5391 (10%) | 11433 (11%) | |
Median HH Income | $37,422 | $46,366 | $48,118 | |
Total Household Income | < 24K | 1440 (34%) | 6379 (28%) | 10895 (25%) |
25-49K | 1054 (25%) | 5584 (24%) | 11011 (25%) | |
50-74K | 605 (14%) | 3698 (16%) | 7416 (17%) | |
75-99K | 340 (8%) | 2164 (9%) | 4077 (9%) | |
100-199K | 511 (12%) | 3572 (15%) | 6840 (16%) | |
200K+ | 207 (4%) | 1356 (5%) | 2324 (5%) | |
Highest Education Level | No Diploma | 522 | 3237 | 6827 |
Diploma or GED | 1093 | 6827 | 13736 | |
Some College | 1573 | 6612 | 12911 | |
Assoc. Degree | 445 | 2611 | 5703 | |
Bachelors Degree | 1887 | 11093 | 19787 | |
Higher Degree | 1155 | 7372 | 12632 | |
Total Housing Units | 5,153 | 26,050 | 48,287 | |
--Owner-Occupied | 1,471 | 11,072 | 22,484 | |
--Renter-Occupied | 2,686 | 11,682 | 20,078 | |
Owner-Occupied Values | < 100K | 34 | 577 | 1717 |
100-199K | 266 | 2228 | 5647 | |
200-299K | 342 | 2721 | 5733 | |
300-399K | 259 | 2056 | 3785 | |
400-499K | 201 | 1361 | 2053 | |
500K+ | 370 | 2129 | 3549 | |
Total Working Age Population | 7,406 | 43,550 | 81,718 | |
In Work Force | 4,796 | 28,347 | 52,555 | |
Not In Work Force | 2,609 | 15,203 | 29,163 | |
Workforce Employed | 4,622 | 27,293 | 50,713 | |
Workforce Unemployed | 174 | 990 | 1,769 | |
Civlian Workforce | 4,796 | 28,283 | 52,481 | |
Military Workforce | 0 | 65 | 74 | |
Total Households | 4,157 | 22,754 | 42,562 | |
Family Households | 1,319 | 10,118 | 21,079 | |
Non-Family Households | 2,838 | 12,636 | 21,483 | |
Married Couple | 949 | 7,543 | 16,118 | |
Other Family | 370 | 2,575 | 4,961 | |
Married w/Child | 346 | 2,898 | 6,005 | |
Single Male w/Child | 52 | 418 | 701 | |
Single Female w/Child | 98 | 901 | 1,920 |
Population Change Last Two Decades - Plus Projection
2000 | % | 2010 | % | 2020 | % | 2030 | |
---|---|---|---|---|---|---|---|
North Carolina | 8,049,313 | +18 | 9,535,483 | +11 | 10,630,691 | +11 | 11,836,070 |
Buncombe County | 206,330 | +16 | 238,318 | +12 | 267,046 | +11 | 296,961 |
Total Working Age Population:
Total Households:
Total Working Age Population:
Total Households:
Total Working Age Population:
Total Households: