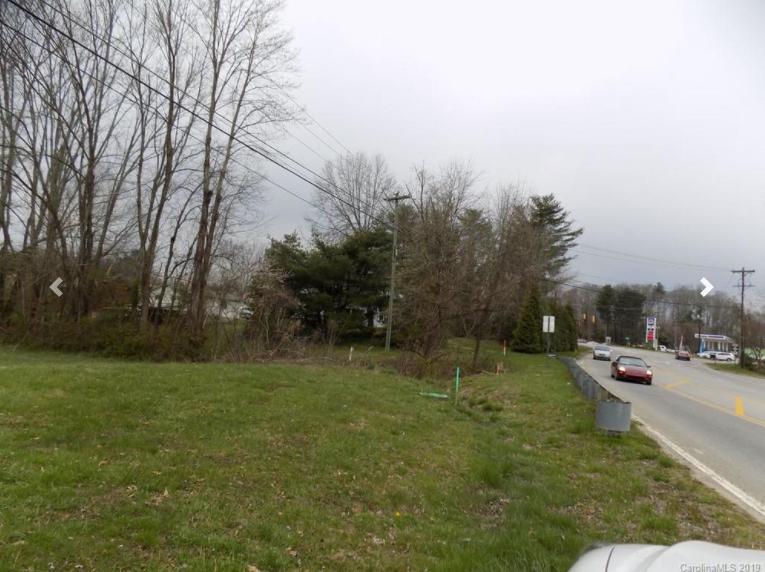
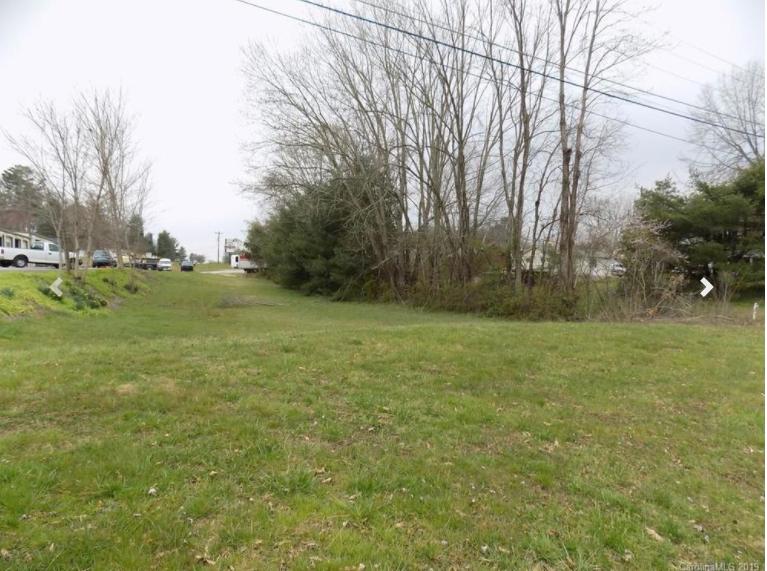
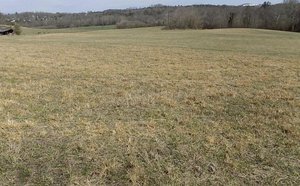
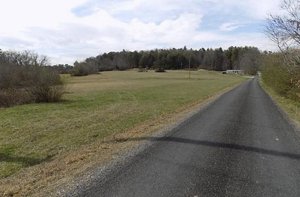
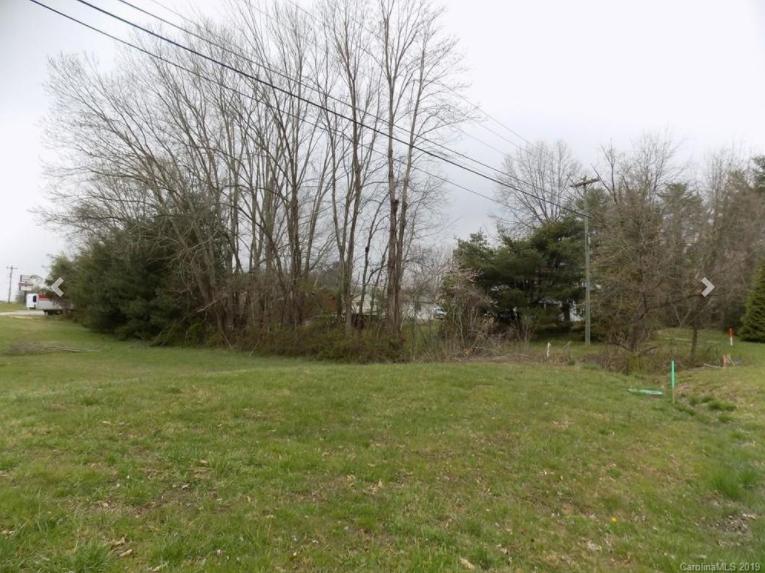
1-Mile | 3-Miles | 5-Miles | ||
---|---|---|---|---|
Total Population | 801 | 9,216 | 34,959 | |
Population Median Age | 42 | 43 | 44 | |
Population by Age | 0-9 Yrs | 80 (9%) | 957 (10%) | 3674 (10%) |
10-19 Yrs | 116 (14%) | 1188 (12%) | 4045 (11%) | |
20-29 Yrs | 75 (9%) | 781 (8%) | 3020 (8%) | |
30-39 Yrs | 94 (11%) | 1065 (11%) | 4041 (11%) | |
40-49 Yrs | 101 (12%) | 1216 (13%) | 4747 (13%) | |
50-59 Yrs | 105 (13%) | 1287 (13%) | 4824 (13%) | |
60-69 Yrs | 114 (14%) | 1304 (14%) | 4792 (13%) | |
70+ Yrs | 117 (14%) | 1419 (15%) | 5817 (16%) | |
Median HH Income | $69,988 | $69,088 | $65,321 | |
Total Household Income | < 24K | 58 (17%) | 524 (13%) | 1966 (13%) |
25-49K | 60 (18%) | 834 (22%) | 3629 (24%) | |
50-74K | 57 (17%) | 691 (18%) | 2868 (19%) | |
75-99K | 54 (16%) | 593 (15%) | 2443 (16%) | |
100-199K | 90 (27%) | 947 (25%) | 3084 (20%) | |
200K+ | 9 (2%) | 171 (4%) | 716 (4%) | |
Highest Education Level | No Diploma | 44 | 526 | 2020 |
Diploma or GED | 130 | 1438 | 5834 | |
Some College | 143 | 1611 | 5903 | |
Assoc. Degree | 44 | 559 | 2483 | |
Bachelors Degree | 137 | 1698 | 6260 | |
Higher Degree | 78 | 863 | 3254 | |
Total Housing Units | 345 | 4,020 | 16,237 | |
--Owner-Occupied | 260 | 3,068 | 11,300 | |
--Renter-Occupied | 69 | 693 | 3,406 | |
Owner-Occupied Values | < 100K | 35 | 512 | 1536 |
100-199K | 44 | 517 | 2694 | |
200-299K | 83 | 936 | 3637 | |
300-399K | 59 | 615 | 1832 | |
400-499K | 17 | 226 | 736 | |
500K+ | 22 | 261 | 865 | |
Total Working Age Population | 648 | 7,550 | 28,827 | |
In Work Force | 406 | 4,687 | 17,503 | |
Not In Work Force | 242 | 2,863 | 11,324 | |
Workforce Employed | 399 | 4,579 | 17,064 | |
Workforce Unemployed | 5 | 100 | 430 | |
Civlian Workforce | 404 | 4,678 | 17,494 | |
Military Workforce | 2 | 9 | 9 | |
Total Households | 329 | 3,760 | 14,706 | |
Family Households | 231 | 2,714 | 9,920 | |
Non-Family Households | 98 | 1,047 | 4,785 | |
Married Couple | 205 | 2,353 | 8,265 | |
Other Family | 26 | 360 | 1,655 | |
Married w/Child | 75 | 841 | 2,755 | |
Single Male w/Child | 3 | 32 | 149 | |
Single Female w/Child | 7 | 80 | 456 |
Population Change Last Two Decades - Plus Projection
2000 | % | 2010 | % | 2020 | % | 2030 | |
---|---|---|---|---|---|---|---|
North Carolina | 8,049,313 | +18 | 9,535,483 | +11 | 10,630,691 | +11 | 11,836,070 |
Buncombe County | 206,330 | +16 | 238,318 | +12 | 267,046 | +11 | 296,961 |
Henderson County | 89,173 | +20 | 106,740 | +12 | 119,730 | +10 | 132,035 |
Transylvania County | 29,334 | +13 | 33,090 | +8 | 35,806 | +8 | 38,768 |
Total Working Age Population:
Total Households:
Total Working Age Population:
Total Households:
Total Working Age Population:
Total Households: