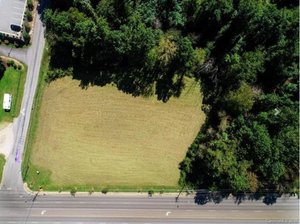
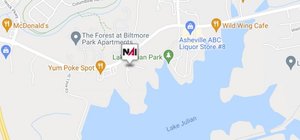
1-Mile | 3-Miles | 5-Miles | ||
---|---|---|---|---|
Total Population | 646 | 7,967 | 18,999 | |
Population Median Age | 48 | 46 | 47 | |
Population by Age | 0-9 Yrs | 29 (4%) | 628 (7%) | 1528 (8%) |
10-19 Yrs | 68 (10%) | 825 (10%) | 1767 (9%) | |
20-29 Yrs | 32 (4%) | 562 (7%) | 1621 (8%) | |
30-39 Yrs | 89 (13%) | 1079 (13%) | 2206 (11%) | |
40-49 Yrs | 103 (15%) | 1004 (12%) | 2145 (11%) | |
50-59 Yrs | 101 (15%) | 1052 (13%) | 2736 (14%) | |
60-69 Yrs | 131 (20%) | 1395 (17%) | 3423 (18%) | |
70+ Yrs | 94 (14%) | 1422 (17%) | 3574 (18%) | |
Median HH Income | $34,996 | $45,572 | $49,002 | |
Total Household Income | < 24K | 82 (26%) | 1065 (27%) | 2253 (25%) |
25-49K | 107 (35%) | 994 (25%) | 2240 (25%) | |
50-74K | 58 (19%) | 711 (18%) | 1761 (19%) | |
75-99K | 20 (6%) | 507 (13%) | 1126 (12%) | |
100-199K | 27 (8%) | 441 (11%) | 1149 (12%) | |
200K+ | 9 (2%) | 126 (3%) | 321 (3%) | |
Highest Education Level | No Diploma | 90 | 1029 | 2140 |
Diploma or GED | 150 | 1455 | 3483 | |
Some College | 139 | 1420 | 3290 | |
Assoc. Degree | 33 | 497 | 1374 | |
Bachelors Degree | 70 | 856 | 2402 | |
Higher Degree | 49 | 902 | 2028 | |
Total Housing Units | 349 | 4,746 | 11,597 | |
--Owner-Occupied | 227 | 2,363 | 6,054 | |
--Renter-Occupied | 78 | 1,481 | 2,795 | |
Owner-Occupied Values | < 100K | 77 | 567 | 1252 |
100-199K | 97 | 829 | 2240 | |
200-299K | 11 | 358 | 1196 | |
300-399K | 27 | 265 | 670 | |
400-499K | 6 | 103 | 247 | |
500K+ | 9 | 241 | 449 | |
Total Working Age Population | 597 | 6,809 | 16,363 | |
In Work Force | 302 | 3,758 | 8,582 | |
Not In Work Force | 295 | 3,051 | 7,781 | |
Workforce Employed | 300 | 3,657 | 8,322 | |
Workforce Unemployed | 2 | 101 | 258 | |
Civlian Workforce | 302 | 3,758 | 8,580 | |
Military Workforce | 0 | 0 | 1 | |
Total Households | 305 | 3,844 | 8,849 | |
Family Households | 184 | 2,240 | 5,303 | |
Non-Family Households | 121 | 1,604 | 3,546 | |
Married Couple | 159 | 1,726 | 4,164 | |
Other Family | 26 | 514 | 1,140 | |
Married w/Child | 47 | 519 | 1,117 | |
Single Male w/Child | 0 | 18 | 87 | |
Single Female w/Child | 8 | 259 | 535 |
Population Change Last Two Decades - Plus Projection
2000 | % | 2010 | % | 2020 | % | 2030 | |
---|---|---|---|---|---|---|---|
North Carolina | 8,049,313 | +18 | 9,535,483 | +11 | 10,630,691 | +11 | 11,836,070 |
Haywood County | 54,033 | +9 | 59,036 | +8 | 63,813 | +8 | 68,680 |
Jackson County | 33,121 | +22 | 40,271 | +11 | 44,848 | +11 | 49,995 |
Transylvania County | 29,334 | +13 | 33,090 | +8 | 35,806 | +8 | 38,768 |
Total Working Age Population:
Total Households:
Total Working Age Population:
Total Households:
Total Working Age Population:
Total Households: