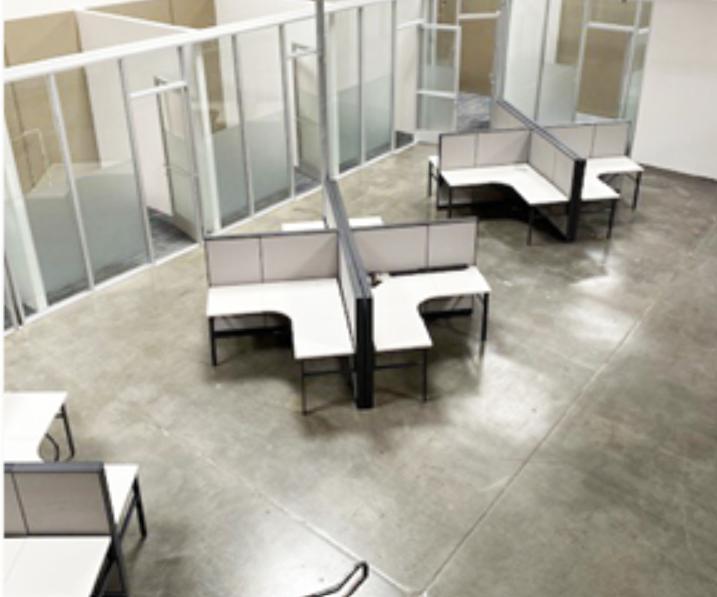
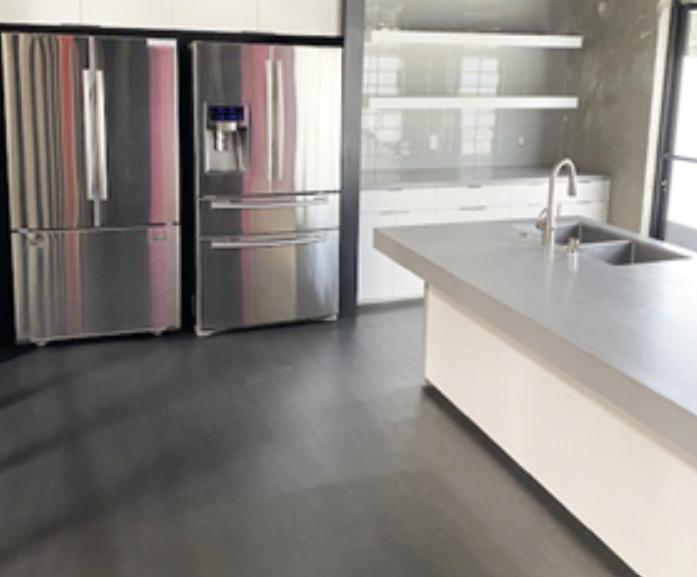
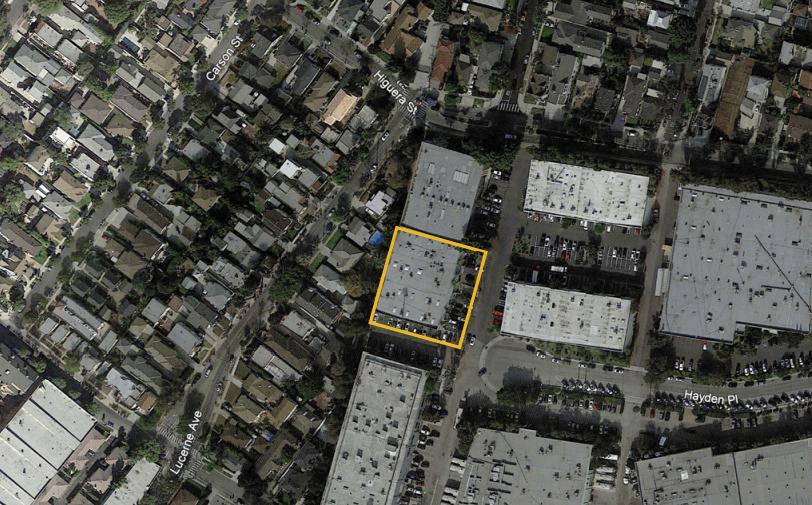
1-Mile | 3-Miles | 5-Miles | ||
---|---|---|---|---|
Total Population | 26,135 | 293,373 | 890,374 | |
Population Median Age | 39 | 39 | 39 | |
Population by Age | 0-9 Yrs | 2020 (7%) | 28436 (9%) | 86381 (9%) |
10-19 Yrs | 1699 (6%) | 27900 (9%) | 89366 (10%) | |
20-29 Yrs | 5237 (20%) | 48437 (16%) | 157728 (17%) | |
30-39 Yrs | 5449 (20%) | 51237 (17%) | 155409 (17%) | |
40-49 Yrs | 4204 (16%) | 42808 (14%) | 120923 (13%) | |
50-59 Yrs | 3029 (11%) | 35858 (12%) | 108398 (12%) | |
60-69 Yrs | 2190 (8%) | 29829 (10%) | 87494 (9%) | |
70+ Yrs | 2306 (8%) | 28868 (9%) | 84675 (9%) | |
Median HH Income | $83,721 | $74,679 | $73,823 | |
Total Household Income | < 24K | 1548 (12%) | 22572 (17%) | 69584 (18%) |
25-49K | 2028 (16%) | 21459 (17%) | 63729 (17%) | |
50-74K | 1874 (15%) | 18981 (15%) | 54023 (14%) | |
75-99K | 2241 (17%) | 16002 (12%) | 42733 (11%) | |
100-199K | 3305 (26%) | 30040 (23%) | 88406 (23%) | |
200K+ | 1469 (11%) | 16505 (13%) | 51400 (13%) | |
Highest Education Level | No Diploma | 1723 | 26803 | 81752 |
Diploma or GED | 1880 | 29364 | 90946 | |
Some College | 3553 | 40289 | 116835 | |
Assoc. Degree | 1216 | 12518 | 37936 | |
Bachelors Degree | 7131 | 63157 | 192963 | |
Higher Degree | 5080 | 46547 | 126621 | |
Total Housing Units | 13,510 | 136,889 | 405,437 | |
--Owner-Occupied | 3,720 | 45,040 | 128,154 | |
--Renter-Occupied | 8,745 | 80,520 | 241,721 | |
Owner-Occupied Values | < 100K | 70 | 680 | 2045 |
100-199K | 29 | 354 | 1361 | |
200-299K | 154 | 851 | 3400 | |
300-399K | 353 | 2237 | 7452 | |
400-499K | 384 | 2904 | 9341 | |
500K+ | 2731 | 38014 | 104555 | |
Total Working Age Population | 23,008 | 247,222 | 755,322 | |
In Work Force | 17,458 | 172,611 | 515,492 | |
Not In Work Force | 5,551 | 74,611 | 239,830 | |
Workforce Employed | 16,902 | 163,463 | 485,616 | |
Workforce Unemployed | 555 | 9,096 | 29,513 | |
Civlian Workforce | 17,458 | 172,559 | 515,129 | |
Military Workforce | 0 | 52 | 363 | |
Total Households | 12,466 | 125,560 | 369,876 | |
Family Households | 5,332 | 63,494 | 182,680 | |
Non-Family Households | 7,133 | 62,066 | 187,196 | |
Married Couple | 3,790 | 44,653 | 124,478 | |
Other Family | 1,542 | 18,841 | 58,203 | |
Married w/Child | 1,601 | 18,832 | 49,490 | |
Single Male w/Child | 87 | 1,991 | 6,333 | |
Single Female w/Child | 407 | 4,843 | 16,602 |
Population Change Last Two Decades - Plus Projection
2000 | % | 2010 | % | 2020 | % | 2030 | |
---|---|---|---|---|---|---|---|
California | 33,871,648 | +10 | 37,253,956 | +9 | 40,467,295 | +8 | 43,631,295 |
Los Angeles County | 9,519,338 | +3 | 9,818,605 | +6 | 10,369,367 | +4 | 10,759,850 |
Total Working Age Population:
Total Households:
Total Working Age Population:
Total Households:
Total Working Age Population:
Total Households: