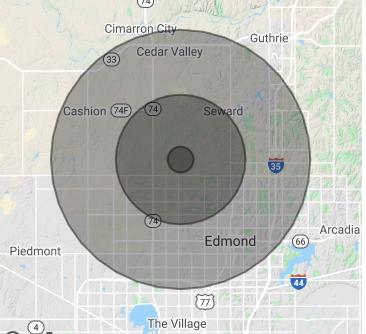
1-Mile | 3-Miles | 5-Miles | ||
---|---|---|---|---|
Total Population | 269 | 7,004 | 37,022 | |
Population Median Age | 38 | 33 | 34 | |
Population by Age | 0-9 Yrs | 34 (12%) | 1206 (17%) | 6608 (17%) |
10-19 Yrs | 60 (22%) | 1241 (17%) | 5899 (15%) | |
20-29 Yrs | 14 (5%) | 623 (8%) | 3553 (9%) | |
30-39 Yrs | 19 (7%) | 1014 (14%) | 5766 (15%) | |
40-49 Yrs | 52 (19%) | 1122 (16%) | 5590 (15%) | |
50-59 Yrs | 35 (13%) | 951 (13%) | 4391 (11%) | |
60-69 Yrs | 33 (12%) | 524 (7%) | 2860 (7%) | |
70+ Yrs | 22 (8%) | 323 (4%) | 2355 (6%) | |
Median HH Income | $95,311 | $112,938 | $110,051 | |
Total Household Income | < 24K | 0 (0%) | 96 (4%) | 668 (5%) |
25-49K | 12 (14%) | 209 (9%) | 1383 (11%) | |
50-74K | 18 (21%) | 370 (16%) | 1365 (11%) | |
75-99K | 14 (16%) | 298 (13%) | 1958 (16%) | |
100-199K | 28 (33%) | 973 (43%) | 4824 (39%) | |
200K+ | 11 (13%) | 280 (12%) | 1911 (15%) | |
Highest Education Level | No Diploma | 12 | 115 | 645 |
Diploma or GED | 25 | 571 | 3021 | |
Some College | 26 | 719 | 4069 | |
Assoc. Degree | 22 | 380 | 1724 | |
Bachelors Degree | 66 | 1451 | 8174 | |
Higher Degree | 14 | 964 | 5296 | |
Total Housing Units | 90 | 2,312 | 12,556 | |
--Owner-Occupied | 76 | 1,863 | 10,159 | |
--Renter-Occupied | 7 | 364 | 1,950 | |
Owner-Occupied Values | < 100K | 1 | 38 | 273 |
100-199K | 3 | 341 | 2104 | |
200-299K | 18 | 583 | 3523 | |
300-399K | 24 | 331 | 1832 | |
400-499K | 13 | 234 | 1169 | |
500K+ | 16 | 335 | 1258 | |
Total Working Age Population | 200 | 5,010 | 26,457 | |
In Work Force | 138 | 3,549 | 18,876 | |
Not In Work Force | 62 | 1,461 | 7,581 | |
Workforce Employed | 132 | 3,475 | 18,409 | |
Workforce Unemployed | 6 | 70 | 390 | |
Civlian Workforce | 138 | 3,545 | 18,800 | |
Military Workforce | 0 | 4 | 76 | |
Total Households | 83 | 2,227 | 12,109 | |
Family Households | 68 | 1,951 | 10,118 | |
Non-Family Households | 15 | 276 | 1,991 | |
Married Couple | 54 | 1,589 | 8,614 | |
Other Family | 14 | 362 | 1,504 | |
Married w/Child | 27 | 928 | 4,804 | |
Single Male w/Child | 4 | 92 | 351 | |
Single Female w/Child | 3 | 123 | 641 |
Population Change Last Two Decades - Plus Projection
2000 | % | 2010 | % | 2020 | % | 2030 | |
---|---|---|---|---|---|---|---|
Oklahoma | 3,450,654 | +9 | 3,751,351 | +7 | 4,024,202 | +7 | 4,302,501 |
Canadian County | 87,697 | +32 | 115,541 | +16 | 133,468 | +13 | 151,440 |
Logan County | 33,924 | +23 | 41,848 | +10 | 46,185 | +9 | 50,462 |
Oklahoma County | 660,448 | +9 | 718,633 | +7 | 772,053 | +6 | 821,230 |
Total Working Age Population:
Total Households:
Total Working Age Population:
Total Households:
Total Working Age Population:
Total Households: