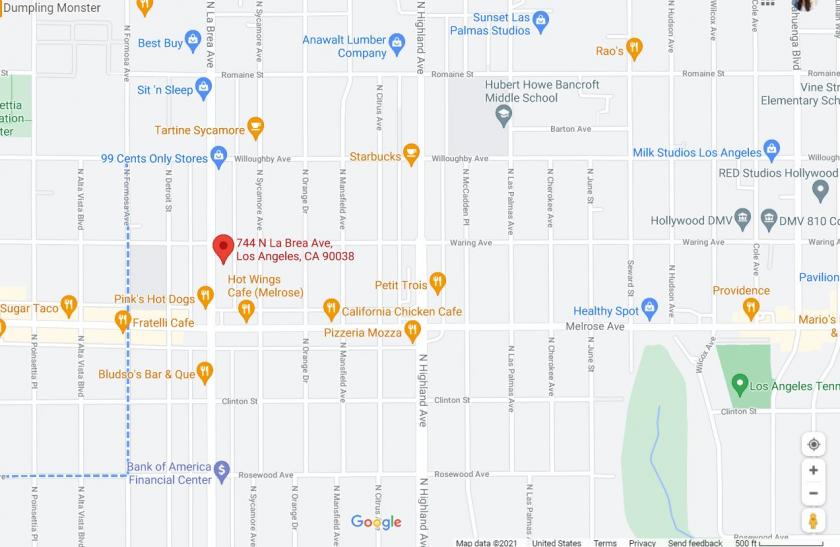
1-Mile | 3-Miles | 5-Miles | ||
---|---|---|---|---|
Total Population | 43,776 | 406,902 | 958,927 | |
Population Median Age | 39 | 40 | 38 | |
Population by Age | 0-9 Yrs | 2846 (6%) | 33090 (8%) | 93397 (9%) |
10-19 Yrs | 2529 (5%) | 27259 (6%) | 85337 (8%) | |
20-29 Yrs | 9765 (22%) | 78250 (19%) | 174144 (18%) | |
30-39 Yrs | 10068 (22%) | 82982 (20%) | 180625 (18%) | |
40-49 Yrs | 6646 (15%) | 60837 (14%) | 137337 (14%) | |
50-59 Yrs | 4582 (10%) | 49666 (12%) | 116199 (12%) | |
60-69 Yrs | 3477 (7%) | 38422 (9%) | 88803 (9%) | |
70+ Yrs | 3864 (8%) | 36397 (8%) | 83085 (8%) | |
Median HH Income | $66,656 | $62,600 | $58,223 | |
Total Household Income | < 24K | 5017 (21%) | 41785 (21%) | 93674 (23%) |
25-49K | 3960 (17%) | 37622 (19%) | 85035 (21%) | |
50-74K | 3616 (15%) | 31244 (16%) | 63442 (15%) | |
75-99K | 2804 (12%) | 21260 (11%) | 43633 (10%) | |
100-199K | 4815 (20%) | 37572 (19%) | 74943 (18%) | |
200K+ | 2797 (12%) | 21586 (11%) | 41665 (10%) | |
Highest Education Level | No Diploma | 2205 | 41525 | 137356 |
Diploma or GED | 4249 | 49421 | 118549 | |
Some College | 6049 | 51040 | 114205 | |
Assoc. Degree | 2262 | 17777 | 39992 | |
Bachelors Degree | 14215 | 109003 | 204007 | |
Higher Degree | 6308 | 50918 | 99583 | |
Total Housing Units | 25,588 | 216,646 | 449,616 | |
--Owner-Occupied | 4,037 | 38,686 | 91,475 | |
--Renter-Occupied | 18,973 | 152,383 | 310,917 | |
Owner-Occupied Values | < 100K | 32 | 578 | 1435 |
100-199K | 38 | 388 | 883 | |
200-299K | 30 | 573 | 1960 | |
300-399K | 96 | 1383 | 4065 | |
400-499K | 224 | 1786 | 5616 | |
500K+ | 3618 | 33978 | 77516 | |
Total Working Age Population | 39,407 | 357,394 | 813,581 | |
In Work Force | 30,531 | 261,476 | 574,977 | |
Not In Work Force | 8,875 | 95,919 | 238,604 | |
Workforce Employed | 28,331 | 245,858 | 539,090 | |
Workforce Unemployed | 2,199 | 15,454 | 35,592 | |
Civlian Workforce | 30,531 | 261,311 | 574,682 | |
Military Workforce | 1 | 164 | 295 | |
Total Households | 23,010 | 191,068 | 402,392 | |
Family Households | 7,213 | 77,218 | 189,964 | |
Non-Family Households | 15,797 | 113,850 | 212,428 | |
Married Couple | 5,634 | 53,813 | 122,943 | |
Other Family | 1,579 | 23,405 | 67,022 | |
Married w/Child | 1,834 | 18,991 | 47,708 | |
Single Male w/Child | 232 | 2,672 | 8,025 | |
Single Female w/Child | 318 | 6,147 | 19,294 |
Population Change Last Two Decades - Plus Projection
2000 | % | 2010 | % | 2020 | % | 2030 | |
---|---|---|---|---|---|---|---|
California | 33,871,648 | +10 | 37,253,956 | +9 | 40,467,295 | +8 | 43,631,295 |
Los Angeles County | 9,519,338 | +3 | 9,818,605 | +6 | 10,369,367 | +4 | 10,759,850 |
Total Working Age Population:
Total Households:
Total Working Age Population:
Total Households:
Total Working Age Population:
Total Households: