Specialty Real Estate
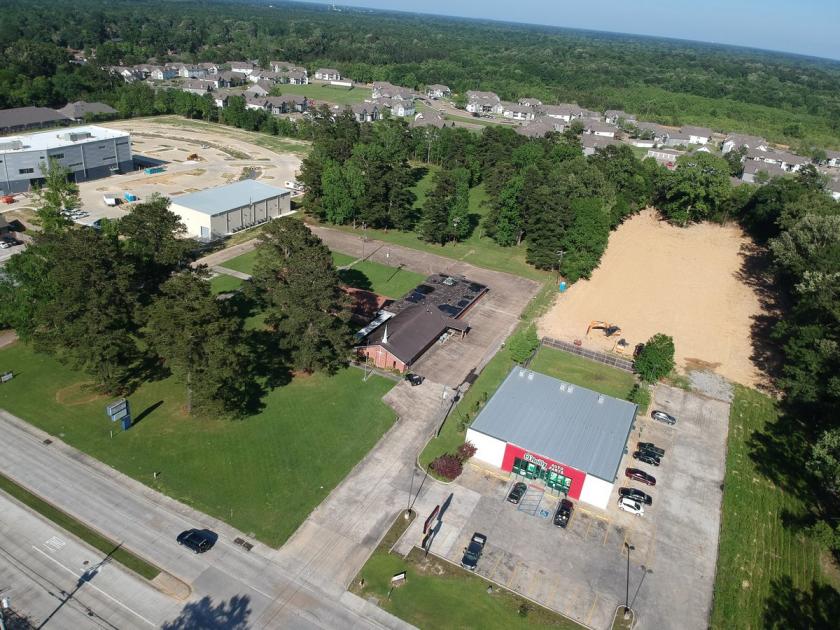
2791 ONeal Lane Baton Rouge, LA 70816
2791 ONeal Lane Baton Rouge, LA 70816

Details & Description
Listing Agents

Thomas Parsons
O: 225-926-4481
M: 225-445-3177
tparsons@eatel.net
O: 225-926-4481
M: 225-445-3177
tparsons@eatel.net
While we strive to provide the most accurate information, all listing information, and demographic data, is provided by third-parties. As such, MyEListing will not be responsible for the accuracy of the information. It is strongly recommended that you verify all information with the listing agent, and any relevant agencies, prior to making any decisions.