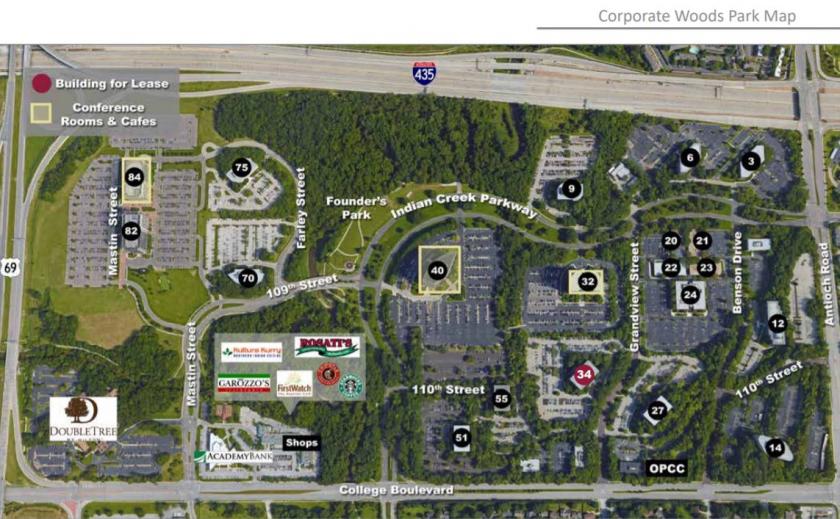
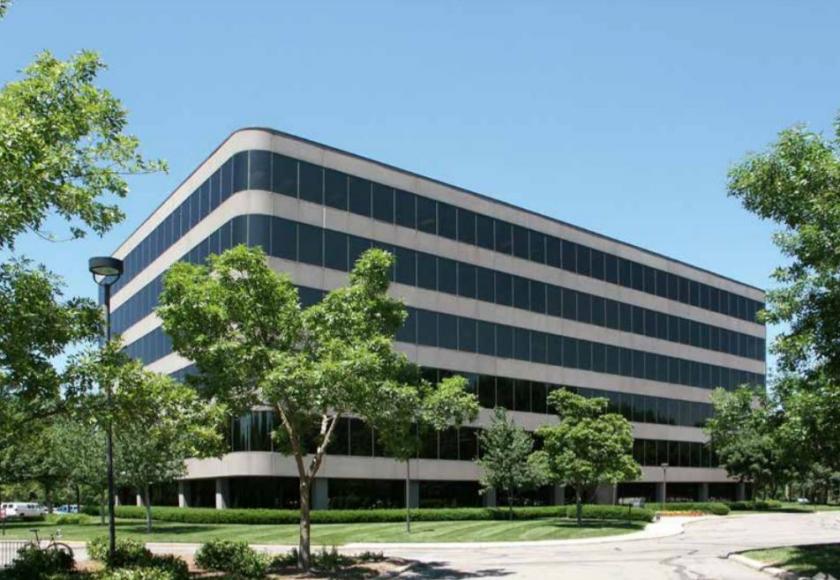
1-Mile | 3-Miles | 5-Miles | ||
---|---|---|---|---|
Total Population | 8,674 | 94,413 | 247,987 | |
Population Median Age | 40 | 41 | 40 | |
Population by Age | 0-9 Yrs | 965 (11%) | 10427 (11%) | 28542 (11%) |
10-19 Yrs | 721 (8%) | 9879 (10%) | 29454 (11%) | |
20-29 Yrs | 1623 (18%) | 13785 (14%) | 34971 (14%) | |
30-39 Yrs | 1402 (16%) | 13431 (14%) | 35076 (14%) | |
40-49 Yrs | 904 (10%) | 10317 (10%) | 29128 (11%) | |
50-59 Yrs | 955 (11%) | 12342 (13%) | 33316 (13%) | |
60-69 Yrs | 1113 (12%) | 12242 (12%) | 29328 (11%) | |
70+ Yrs | 992 (11%) | 11990 (12%) | 28171 (11%) | |
Median HH Income | $74,941 | $78,787 | $83,554 | |
Total Household Income | < 24K | 358 (8%) | 3733 (9%) | 9896 (9%) |
25-49K | 853 (21%) | 7887 (19%) | 19261 (18%) | |
50-74K | 805 (19%) | 7999 (19%) | 17976 (17%) | |
75-99K | 518 (12%) | 6020 (14%) | 14055 (13%) | |
100-199K | 1150 (28%) | 11839 (28%) | 29560 (28%) | |
200K+ | 343 (8%) | 3585 (8%) | 13137 (12%) | |
Highest Education Level | No Diploma | 236 | 2421 | 6212 |
Diploma or GED | 756 | 9147 | 22463 | |
Some College | 982 | 12463 | 30558 | |
Assoc. Degree | 500 | 4578 | 11597 | |
Bachelors Degree | 2227 | 24376 | 62999 | |
Higher Degree | 1469 | 14787 | 40333 | |
Total Housing Units | 4,320 | 43,801 | 110,617 | |
--Owner-Occupied | 2,076 | 25,793 | 63,466 | |
--Renter-Occupied | 1,950 | 15,269 | 40,419 | |
Owner-Occupied Values | < 100K | 102 | 1080 | 2266 |
100-199K | 272 | 7255 | 15516 | |
200-299K | 1120 | 10333 | 19929 | |
300-399K | 562 | 4958 | 12885 | |
400-499K | 16 | 1445 | 6066 | |
500K+ | 5 | 722 | 6805 | |
Total Working Age Population | 7,275 | 78,013 | 201,358 | |
In Work Force | 5,304 | 55,154 | 142,329 | |
Not In Work Force | 1,972 | 22,860 | 59,029 | |
Workforce Employed | 5,192 | 53,658 | 137,888 | |
Workforce Unemployed | 112 | 1,432 | 4,331 | |
Civlian Workforce | 5,304 | 55,090 | 142,219 | |
Military Workforce | 0 | 64 | 110 | |
Total Households | 4,026 | 41,062 | 103,885 | |
Family Households | 2,261 | 24,629 | 64,414 | |
Non-Family Households | 1,765 | 16,433 | 39,471 | |
Married Couple | 1,777 | 19,691 | 52,122 | |
Other Family | 484 | 4,938 | 12,292 | |
Married w/Child | 650 | 7,302 | 20,906 | |
Single Male w/Child | 66 | 597 | 1,782 | |
Single Female w/Child | 153 | 1,916 | 5,135 |
Population Change Last Two Decades - Plus Projection
2000 | % | 2010 | % | 2020 | % | 2030 | |
---|---|---|---|---|---|---|---|
Kansas | 2,688,418 | +6 | 2,853,118 | +5 | 2,988,194 | +5 | 3,140,008 |
Johnson County | 451,086 | +21 | 544,179 | +15 | 625,524 | +17 | 734,065 |
Leavenworth County | 68,691 | +11 | 76,227 | +10 | 83,566 | +11 | 92,787 |
Wyandotte County | 157,882 | 0 | 157,505 | +5 | 165,672 | +2 | 169,789 |
Missouri | 5,595,211 | +7 | 5,988,927 | +7 | 6,389,850 | +6 | 6,746,762 |
Jackson County | 654,880 | +3 | 674,158 | +2 | 689,226 | +4 | 714,467 |
Total Working Age Population:
Total Households:
Total Working Age Population:
Total Households:
Total Working Age Population:
Total Households: