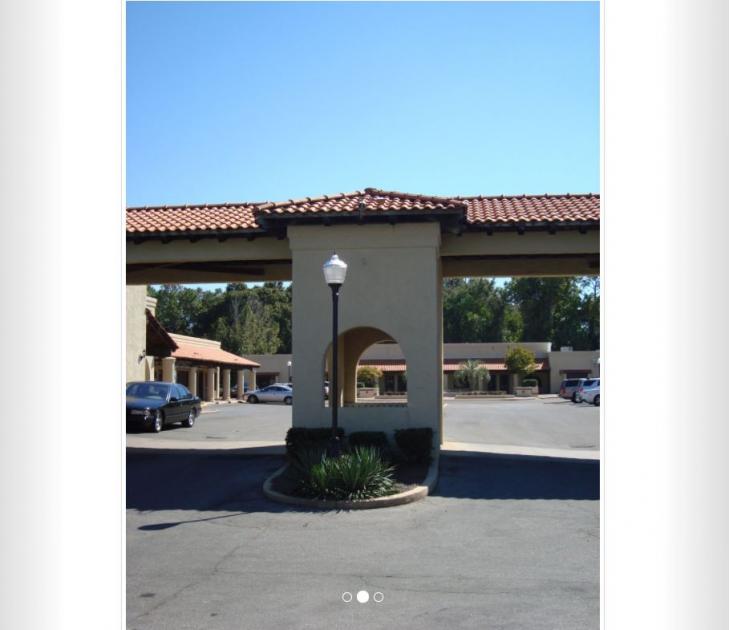
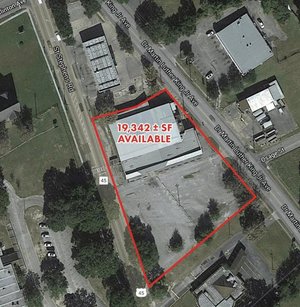
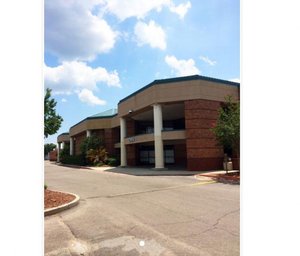
1-Mile | 3-Miles | 5-Miles | ||
---|---|---|---|---|
Total Population | 10,229 | 68,922 | 140,823 | |
Population Median Age | 39 | 39 | 39 | |
Population by Age | 0-9 Yrs | 989 (9%) | 6774 (9%) | 16242 (11%) |
10-19 Yrs | 1111 (10%) | 8724 (12%) | 18055 (12%) | |
20-29 Yrs | 2182 (21%) | 12693 (18%) | 22279 (15%) | |
30-39 Yrs | 1461 (14%) | 8948 (12%) | 19056 (13%) | |
40-49 Yrs | 1140 (11%) | 8459 (12%) | 17091 (12%) | |
50-59 Yrs | 1002 (9%) | 7408 (10%) | 16796 (11%) | |
60-69 Yrs | 985 (9%) | 7863 (11%) | 16226 (11%) | |
70+ Yrs | 1359 (13%) | 8053 (11%) | 15078 (10%) | |
Median HH Income | $43,787 | $48,015 | $49,532 | |
Total Household Income | < 24K | 1439 (29%) | 8343 (27%) | 15591 (26%) |
25-49K | 1210 (24%) | 6951 (23%) | 13680 (23%) | |
50-74K | 664 (13%) | 5043 (16%) | 10459 (17%) | |
75-99K | 588 (12%) | 3589 (12%) | 6829 (11%) | |
100-199K | 813 (16%) | 4620 (15%) | 9098 (15%) | |
200K+ | 156 (3%) | 1349 (4%) | 2504 (4%) | |
Highest Education Level | No Diploma | 439 | 3638 | 8066 |
Diploma or GED | 1393 | 11769 | 26430 | |
Some College | 1602 | 11003 | 21735 | |
Assoc. Degree | 587 | 3504 | 7637 | |
Bachelors Degree | 1864 | 11091 | 20901 | |
Higher Degree | 1147 | 6240 | 11111 | |
Total Housing Units | 5,457 | 34,263 | 66,488 | |
--Owner-Occupied | 2,497 | 15,210 | 32,129 | |
--Renter-Occupied | 2,373 | 14,685 | 26,031 | |
Owner-Occupied Values | < 100K | 275 | 2853 | 7801 |
100-199K | 1320 | 6897 | 14991 | |
200-299K | 559 | 2883 | 5023 | |
300-399K | 243 | 1233 | 2023 | |
400-499K | 58 | 439 | 976 | |
500K+ | 41 | 904 | 1315 | |
Total Working Age Population | 8,668 | 57,291 | 114,260 | |
In Work Force | 5,171 | 34,486 | 69,346 | |
Not In Work Force | 3,497 | 22,805 | 44,914 | |
Workforce Employed | 4,962 | 32,789 | 65,393 | |
Workforce Unemployed | 193 | 1,525 | 3,642 | |
Civlian Workforce | 5,156 | 34,314 | 69,035 | |
Military Workforce | 15 | 172 | 311 | |
Total Households | 4,870 | 29,895 | 58,160 | |
Family Households | 2,265 | 15,823 | 33,407 | |
Non-Family Households | 2,605 | 14,072 | 24,753 | |
Married Couple | 1,664 | 11,036 | 22,934 | |
Other Family | 601 | 4,786 | 10,473 | |
Married w/Child | 585 | 3,660 | 7,884 | |
Single Male w/Child | 24 | 294 | 874 | |
Single Female w/Child | 294 | 2,065 | 4,583 |
Population Change Last Two Decades - Plus Projection
2000 | % | 2010 | % | 2020 | % | 2030 | |
---|---|---|---|---|---|---|---|
Alabama | 4,447,100 | +7 | 4,779,736 | +3 | 4,940,253 | +4 | 5,124,380 |
Mobile County | 399,843 | +3 | 412,992 | +1 | 416,420 | +2 | 423,249 |
Total Working Age Population:
Total Households:
Total Working Age Population:
Total Households:
Total Working Age Population:
Total Households: