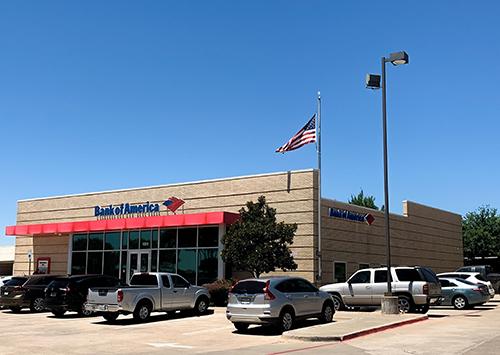
Occupied since 2003 by Bank of America, the 2nd largest bank in the United States, with an A+ credit rating.
- Current term runs through October 2022, with two (2), 5-year extension options at fair market value (FMV).
- NOI in excess of $249,000 for 2020 & 2021
- High traffic location with a strong, loyal customer base, the Green Oaks branch comprises 30.30% of the deposit market share in the 76016 zip code.
- Ranks in the Top 5 for total branch deposits (Tarrant County Bank of America locations)
- Recently completed interior remodel, funded 100% by Tenant.
- This offering represents an opportunity for qualified investors to acquire a low maintenance, steady cash flowing asset, positioned in a submarket poised for steady growth over the next 5 years.
No part of this information may be copied, reproduced, repurposed, or screen-captured for any commercial purpose without prior written authorization from MyEListing.
While we strive to provide the most accurate information, all listing information, and demographic data, is provided by third-parties. As such, MyEListing will not be responsible for the accuracy of the information. It is strongly recommended that you verify all information with the listing agent, and any relevant agencies, prior to making any decisions.
What is the building size of this Retail property in Arlington, TX?
The size of the building/unit at 4220 West Green Oaks Boulevard in Arlington is 6,926 square feet
How much land does the Arlington, TX property at 4220 West Green Oaks Boulevard include?
4220 West Green Oaks Boulevard in Arlington includes 2.050 acres of land
What kind of Retail is the propery at 4220 West Green Oaks Boulevard?
The property at 4220 West Green Oaks Boulevard Arlington, TX 76016 is listed as a Other Retail Retail property
What is the population within 1 mile of 4220 West Green Oaks Boulevard in Arlington?
The population within 1 mile of 4220 West Green Oaks Boulevard Arlington, TX 76016 is 13,201 people.
Who do I contact for questions about 4220 West Green Oaks Boulevard?
You should contact the listing agent,
Erik Blais, for any details regarding this commercial listing.