Industrial Properties
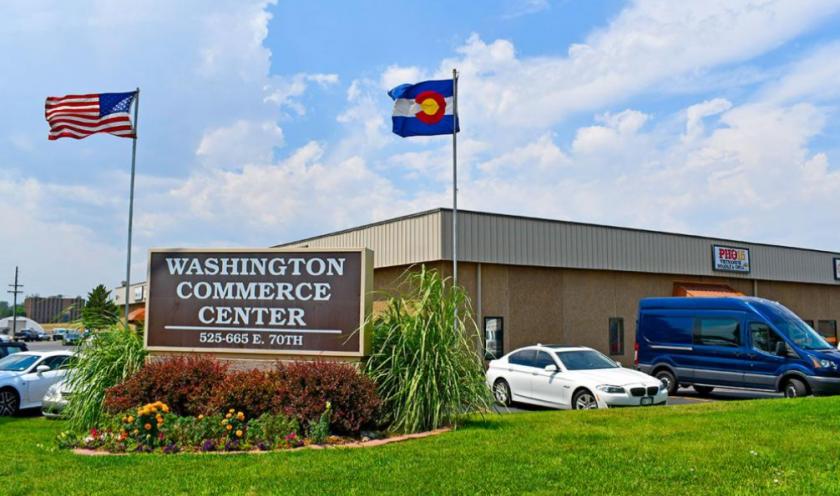
525 East 70th Avenue Denver, CO 80229
525 East 70th Avenue Denver, CO 80229
Details & Description
Listing Agents

Brit Banks
O: 303449142012
M: 303-903-9775
bbanks@deancallan.com
O: 303449142012
M: 303-903-9775
bbanks@deancallan.com

Torrey Patterson
Dean Callan & Company INC
O: 720-826-2291
M: 303-514-4559
tpatterson@deancallan.com
Dean Callan & Company INC
O: 720-826-2291
M: 303-514-4559
tpatterson@deancallan.com
While we strive to provide the most accurate information, all listing information, and demographic data, is provided by third-parties. As such, MyEListing will not be responsible for the accuracy of the information. It is strongly recommended that you verify all information with the listing agent, and any relevant agencies, prior to making any decisions.


