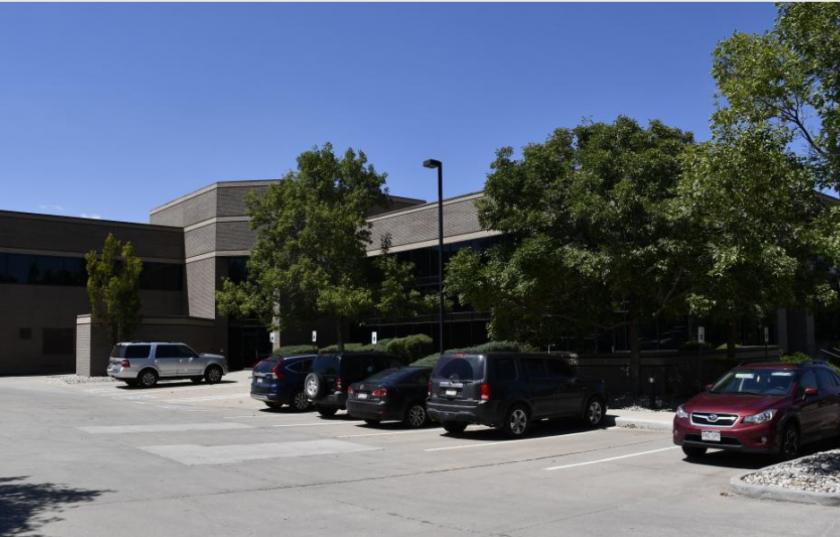
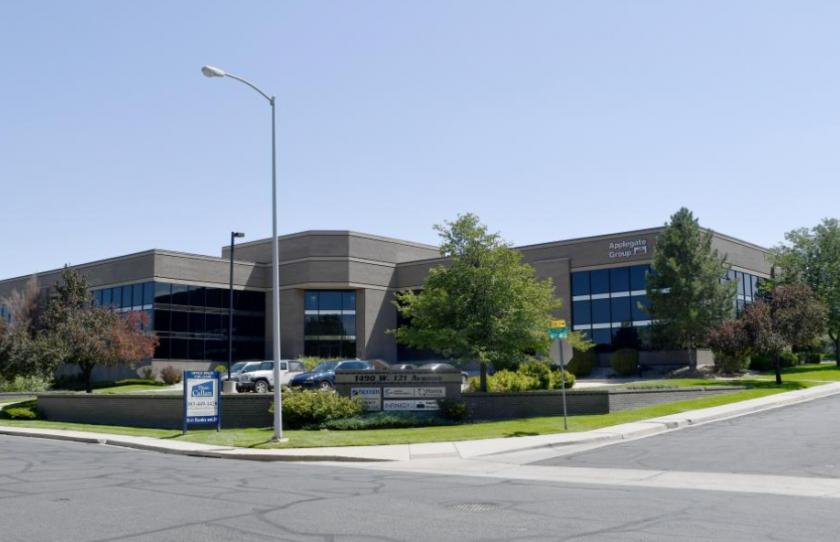
1-Mile | 3-Miles | 5-Miles | ||
---|---|---|---|---|
Total Population | 8,992 | 121,823 | 301,658 | |
Population Median Age | 39 | 37 | 36 | |
Population by Age | 0-9 Yrs | 893 (9%) | 16701 (13%) | 41943 (13%) |
10-19 Yrs | 1168 (12%) | 16044 (13%) | 41638 (13%) | |
20-29 Yrs | 1179 (13%) | 16565 (13%) | 42872 (14%) | |
30-39 Yrs | 1350 (15%) | 18821 (15%) | 47754 (15%) | |
40-49 Yrs | 1394 (15%) | 16802 (13%) | 39891 (13%) | |
50-59 Yrs | 1070 (11%) | 16029 (13%) | 38283 (12%) | |
60-69 Yrs | 1262 (14%) | 11536 (9%) | 27281 (9%) | |
70+ Yrs | 677 (7%) | 9326 (7%) | 21996 (7%) | |
Median HH Income | $94,355 | $83,257 | $78,330 | |
Total Household Income | < 24K | 349 (9%) | 4437 (9%) | 11379 (10%) |
25-49K | 670 (18%) | 8021 (17%) | 20021 (18%) | |
50-74K | 485 (13%) | 7800 (17%) | 20695 (19%) | |
75-99K | 447 (12%) | 6340 (14%) | 16672 (15%) | |
100-199K | 1129 (30%) | 13547 (30%) | 30825 (28%) | |
200K+ | 620 (16%) | 4560 (10%) | 9040 (8%) | |
Highest Education Level | No Diploma | 200 | 6224 | 20752 |
Diploma or GED | 1084 | 18011 | 47078 | |
Some College | 1239 | 18219 | 43679 | |
Assoc. Degree | 601 | 7488 | 18248 | |
Bachelors Degree | 1911 | 20243 | 45845 | |
Higher Degree | 1373 | 11642 | 23720 | |
Total Housing Units | 3,850 | 46,203 | 112,492 | |
--Owner-Occupied | 2,364 | 30,169 | 72,001 | |
--Renter-Occupied | 1,336 | 14,535 | 36,631 | |
Owner-Occupied Values | < 100K | 63 | 1866 | 4968 |
100-199K | 75 | 1851 | 5070 | |
200-299K | 239 | 6081 | 17577 | |
300-399K | 689 | 9496 | 23031 | |
400-499K | 527 | 5016 | 10735 | |
500K+ | 770 | 5859 | 10619 | |
Total Working Age Population | 7,320 | 94,976 | 233,502 | |
In Work Force | 5,272 | 69,128 | 170,963 | |
Not In Work Force | 2,048 | 25,848 | 62,539 | |
Workforce Employed | 5,127 | 66,799 | 164,576 | |
Workforce Unemployed | 138 | 2,242 | 6,198 | |
Civlian Workforce | 5,265 | 69,041 | 170,773 | |
Military Workforce | 8 | 88 | 189 | |
Total Households | 3,700 | 44,704 | 108,632 | |
Family Households | 2,485 | 30,898 | 73,879 | |
Non-Family Households | 1,215 | 13,806 | 34,753 | |
Married Couple | 2,061 | 23,915 | 56,059 | |
Other Family | 425 | 6,983 | 17,820 | |
Married w/Child | 814 | 10,768 | 25,277 | |
Single Male w/Child | 39 | 1,022 | 3,102 | |
Single Female w/Child | 186 | 2,584 | 6,758 |
Population Change Last Two Decades - Plus Projection
2000 | % | 2010 | % | 2020 | % | 2030 | |
---|---|---|---|---|---|---|---|
Colorado | 4,301,261 | +17 | 5,029,196 | +16 | 5,838,181 | +15 | 6,733,658 |
Adams County | 363,857 | +21 | 441,603 | +20 | 530,680 | +21 | 642,318 |
Boulder County | 291,288 | +1 | 294,567 | +13 | 332,134 | +12 | 370,618 |
Broomfield County | 0 | 55,889 | +32 | 73,822 | +28 | 94,282 | |
Denver County | 554,636 | +8 | 600,158 | +23 | 738,611 | +12 | 827,681 |
Jefferson County | 527,056 | +1 | 534,543 | +10 | 587,118 | +7 | 626,742 |
Total Working Age Population:
Total Households:
Total Working Age Population:
Total Households:
Total Working Age Population:
Total Households: