Flex-Office-Warehouse
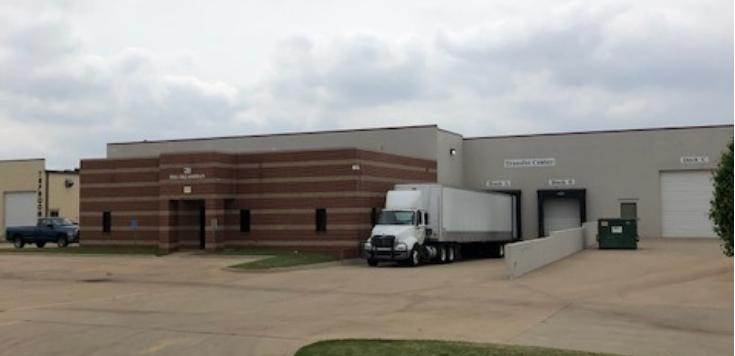
4701 Council Heights Road Oklahoma City, OK 73179
4701 Council Heights Road Oklahoma City, OK 73179
Details & Description
Listing Agents

Danny Rivera
O: 405-239-1256
M: 405-408-5449
drivera@priceedwards.com
O: 405-239-1256
M: 405-408-5449
drivera@priceedwards.com
While we strive to provide the most accurate information, all listing information, and demographic data, is provided by third-parties. As such, MyEListing will not be responsible for the accuracy of the information. It is strongly recommended that you verify all information with the listing agent, and any relevant agencies, prior to making any decisions.


