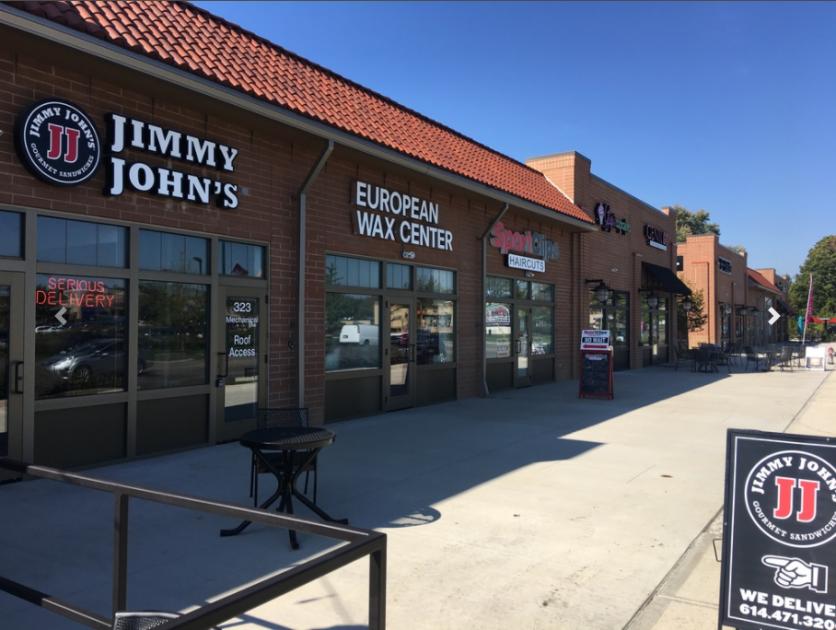
1-Mile | 3-Miles | 5-Miles | ||
---|---|---|---|---|
Total Population | 6,621 | 55,817 | 226,989 | |
Population Median Age | 38 | 38 | 36 | |
Population by Age | 0-9 Yrs | 786 (11%) | 7896 (14%) | 34102 (15%) |
10-19 Yrs | 918 (13%) | 6903 (12%) | 28860 (12%) | |
20-29 Yrs | 804 (12%) | 6960 (12%) | 32252 (14%) | |
30-39 Yrs | 1026 (15%) | 9165 (16%) | 34635 (15%) | |
40-49 Yrs | 902 (13%) | 6699 (12%) | 27921 (12%) | |
50-59 Yrs | 813 (12%) | 7128 (12%) | 28046 (12%) | |
60-69 Yrs | 794 (11%) | 5956 (10%) | 22000 (9%) | |
70+ Yrs | 578 (8%) | 5111 (9%) | 19173 (8%) | |
Median HH Income | $71,633 | $72,394 | $59,008 | |
Total Household Income | < 24K | 244 (9%) | 3286 (14%) | 17052 (19%) |
25-49K | 648 (24%) | 3994 (18%) | 21224 (23%) | |
50-74K | 484 (18%) | 4077 (18%) | 16167 (18%) | |
75-99K | 503 (18%) | 3199 (14%) | 11387 (12%) | |
100-199K | 666 (25%) | 5871 (26%) | 18576 (20%) | |
200K+ | 114 (4%) | 1496 (6%) | 4856 (5%) | |
Highest Education Level | No Diploma | 141 | 1932 | 13030 |
Diploma or GED | 1049 | 9542 | 40245 | |
Some College | 1156 | 7689 | 32301 | |
Assoc. Degree | 413 | 2930 | 11132 | |
Bachelors Degree | 1351 | 10544 | 35093 | |
Higher Degree | 548 | 5812 | 19432 | |
Total Housing Units | 2,707 | 23,020 | 95,312 | |
--Owner-Occupied | 1,553 | 13,253 | 49,159 | |
--Renter-Occupied | 1,105 | 8,669 | 40,103 | |
Owner-Occupied Values | < 100K | 36 | 897 | 10676 |
100-199K | 841 | 5299 | 19321 | |
200-299K | 612 | 4639 | 10835 | |
300-399K | 43 | 1497 | 4028 | |
400-499K | 5 | 449 | 1576 | |
500K+ | 16 | 472 | 2722 | |
Total Working Age Population | 5,211 | 43,231 | 174,715 | |
In Work Force | 3,763 | 30,771 | 122,884 | |
Not In Work Force | 1,448 | 12,460 | 51,831 | |
Workforce Employed | 3,635 | 29,642 | 115,487 | |
Workforce Unemployed | 115 | 1,083 | 7,295 | |
Civlian Workforce | 3,749 | 30,726 | 122,782 | |
Military Workforce | 13 | 45 | 103 | |
Total Households | 2,658 | 21,922 | 89,262 | |
Family Households | 1,829 | 14,373 | 55,422 | |
Non-Family Households | 829 | 7,549 | 33,841 | |
Married Couple | 1,268 | 10,028 | 35,336 | |
Other Family | 561 | 4,345 | 20,085 | |
Married w/Child | 478 | 4,210 | 15,185 | |
Single Male w/Child | 151 | 831 | 2,586 | |
Single Female w/Child | 208 | 1,530 | 8,556 |
Population Change Last Two Decades - Plus Projection
2000 | % | 2010 | % | 2020 | % | 2030 | |
---|---|---|---|---|---|---|---|
Ohio | 11,353,140 | +2 | 11,536,504 | 0 | 11,574,870 | 0 | 11,615,100 |
Franklin County | 1,068,978 | +9 | 1,163,414 | +11 | 1,291,320 | +8 | 1,394,980 |
Licking County | 145,491 | +14 | 166,492 | +9 | 180,860 | +9 | 196,570 |
Total Working Age Population:
Total Households:
Total Working Age Population:
Total Households:
Total Working Age Population:
Total Households: