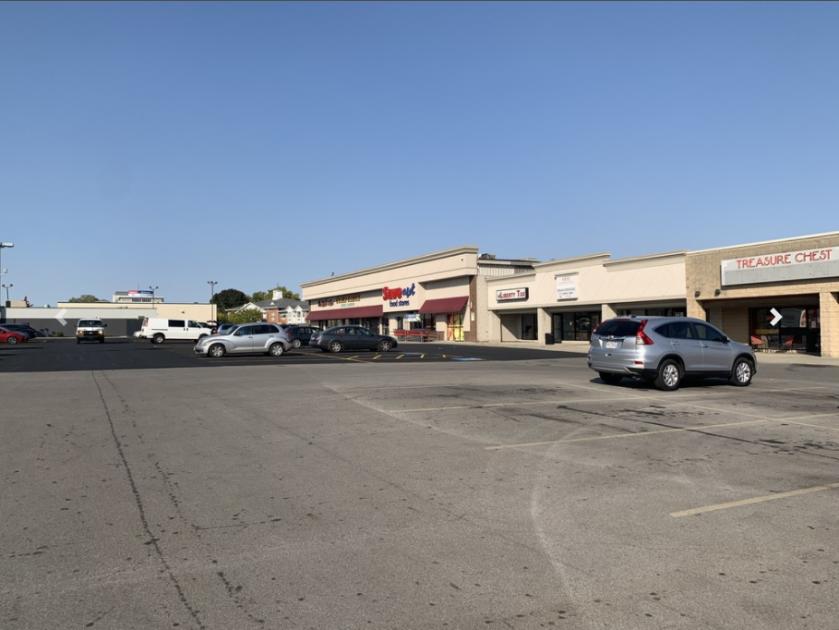
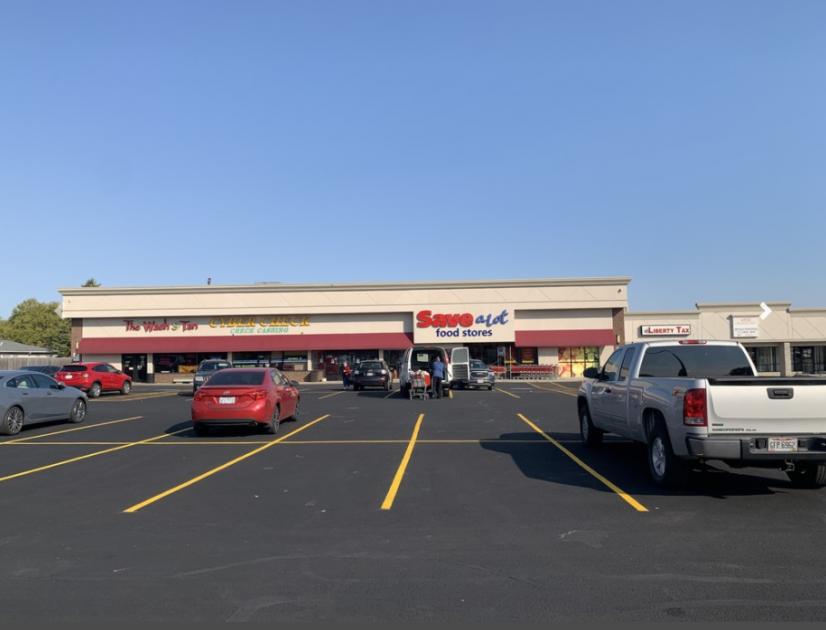
1-Mile | 3-Miles | 5-Miles | ||
---|---|---|---|---|
Total Population | 16,147 | 91,894 | 203,115 | |
Population Median Age | 36 | 35 | 35 | |
Population by Age | 0-9 Yrs | 2243 (13%) | 14307 (15%) | 30196 (14%) |
10-19 Yrs | 2349 (14%) | 12092 (13%) | 26742 (13%) | |
20-29 Yrs | 2147 (13%) | 13545 (14%) | 29677 (14%) | |
30-39 Yrs | 2462 (15%) | 14803 (16%) | 31859 (15%) | |
40-49 Yrs | 2130 (13%) | 11922 (12%) | 26654 (13%) | |
50-59 Yrs | 1951 (12%) | 11303 (12%) | 25831 (12%) | |
60-69 Yrs | 1644 (10%) | 8250 (8%) | 19479 (9%) | |
70+ Yrs | 1222 (7%) | 5671 (6%) | 12678 (6%) | |
Median HH Income | $46,997 | $52,560 | $58,260 | |
Total Household Income | < 24K | 1302 (21%) | 7812 (21%) | 15687 (20%) |
25-49K | 1985 (32%) | 9132 (25%) | 17594 (22%) | |
50-74K | 1599 (26%) | 8038 (22%) | 16335 (20%) | |
75-99K | 610 (9%) | 4697 (13%) | 10472 (13%) | |
100-199K | 592 (9%) | 5570 (15%) | 15323 (19%) | |
200K+ | 40 (0%) | 551 (1%) | 2939 (3%) | |
Highest Education Level | No Diploma | 2152 | 8612 | 16871 |
Diploma or GED | 4222 | 19370 | 40713 | |
Some College | 2310 | 12746 | 26441 | |
Assoc. Degree | 583 | 5046 | 10348 | |
Bachelors Degree | 997 | 10047 | 26769 | |
Higher Degree | 427 | 4318 | 13638 | |
Total Housing Units | 6,493 | 38,392 | 84,975 | |
--Owner-Occupied | 3,011 | 17,828 | 43,484 | |
--Renter-Occupied | 3,117 | 17,972 | 34,866 | |
Owner-Occupied Values | < 100K | 1281 | 4748 | 10841 |
100-199K | 1606 | 10409 | 21148 | |
200-299K | 60 | 2108 | 7532 | |
300-399K | 0 | 297 | 1478 | |
400-499K | 0 | 89 | 624 | |
500K+ | 64 | 176 | 1861 | |
Total Working Age Population | 12,469 | 69,877 | 155,936 | |
In Work Force | 8,454 | 48,970 | 107,769 | |
Not In Work Force | 4,015 | 20,907 | 48,167 | |
Workforce Employed | 7,945 | 46,649 | 103,459 | |
Workforce Unemployed | 509 | 2,289 | 4,199 | |
Civlian Workforce | 8,454 | 48,937 | 107,658 | |
Military Workforce | 0 | 32 | 111 | |
Total Households | 6,128 | 35,801 | 78,349 | |
Family Households | 3,646 | 21,719 | 48,737 | |
Non-Family Households | 2,482 | 14,082 | 29,612 | |
Married Couple | 2,167 | 13,593 | 32,128 | |
Other Family | 1,479 | 8,126 | 16,609 | |
Married w/Child | 832 | 5,859 | 13,943 | |
Single Male w/Child | 298 | 1,250 | 2,439 | |
Single Female w/Child | 440 | 3,325 | 6,573 |
Population Change Last Two Decades - Plus Projection
2000 | % | 2010 | % | 2020 | % | 2030 | |
---|---|---|---|---|---|---|---|
Ohio | 11,353,140 | +2 | 11,536,504 | 0 | 11,574,870 | 0 | 11,615,100 |
Franklin County | 1,068,978 | +9 | 1,163,414 | +11 | 1,291,320 | +8 | 1,394,980 |
Madison County | 40,213 | +8 | 43,435 | +5 | 45,670 | +4 | 47,420 |
Total Working Age Population:
Total Households:
Total Working Age Population:
Total Households:
Total Working Age Population:
Total Households: