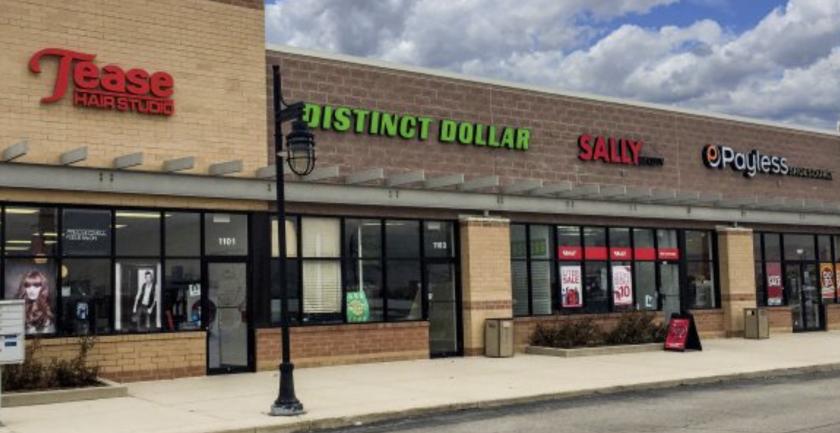
1-Mile | 3-Miles | 5-Miles | ||
---|---|---|---|---|
Total Population | 8,439 | 69,675 | 142,321 | |
Population Median Age | 36 | 37 | 37 | |
Population by Age | 0-9 Yrs | 1142 (13%) | 8782 (12%) | 17340 (12%) |
10-19 Yrs | 1453 (17%) | 10981 (15%) | 21983 (15%) | |
20-29 Yrs | 1016 (12%) | 8888 (12%) | 18926 (13%) | |
30-39 Yrs | 1067 (12%) | 8924 (12%) | 17606 (12%) | |
40-49 Yrs | 1383 (16%) | 10785 (15%) | 21126 (14%) | |
50-59 Yrs | 1029 (12%) | 8888 (12%) | 18439 (12%) | |
60-69 Yrs | 748 (8%) | 7326 (10%) | 14487 (10%) | |
70+ Yrs | 601 (7%) | 5101 (7%) | 12413 (8%) | |
Median HH Income | $97,785 | $94,795 | $82,687 | |
Total Household Income | < 24K | 214 (8%) | 1998 (8%) | 5530 (11%) |
25-49K | 325 (12%) | 2769 (12%) | 7936 (16%) | |
50-74K | 365 (13%) | 3334 (14%) | 8456 (17%) | |
75-99K | 463 (17%) | 4042 (17%) | 7654 (15%) | |
100-199K | 1140 (42%) | 8845 (39%) | 16065 (33%) | |
200K+ | 145 (5%) | 1616 (7%) | 2912 (5%) | |
Highest Education Level | No Diploma | 552 | 3506 | 8006 |
Diploma or GED | 1447 | 13078 | 27218 | |
Some College | 1343 | 10904 | 22608 | |
Assoc. Degree | 458 | 4274 | 8637 | |
Bachelors Degree | 1098 | 9331 | 18107 | |
Higher Degree | 495 | 4449 | 8646 | |
Total Housing Units | 2,704 | 23,422 | 50,899 | |
--Owner-Occupied | 2,368 | 19,588 | 39,022 | |
--Renter-Occupied | 283 | 3,016 | 9,530 | |
Owner-Occupied Values | < 100K | 102 | 809 | 2350 |
100-199K | 803 | 7355 | 16547 | |
200-299K | 1202 | 8735 | 14738 | |
300-399K | 185 | 1950 | 3751 | |
400-499K | 29 | 359 | 850 | |
500K+ | 48 | 379 | 787 | |
Total Working Age Population | 6,410 | 54,140 | 111,428 | |
In Work Force | 4,698 | 38,950 | 77,952 | |
Not In Work Force | 1,712 | 15,190 | 33,476 | |
Workforce Employed | 4,472 | 37,222 | 73,983 | |
Workforce Unemployed | 217 | 1,693 | 3,910 | |
Civlian Workforce | 4,690 | 38,915 | 77,892 | |
Military Workforce | 8 | 35 | 60 | |
Total Households | 2,652 | 22,604 | 48,552 | |
Family Households | 2,086 | 17,473 | 35,001 | |
Non-Family Households | 566 | 5,131 | 13,552 | |
Married Couple | 1,669 | 14,012 | 26,789 | |
Other Family | 417 | 3,461 | 8,211 | |
Married w/Child | 852 | 6,524 | 12,042 | |
Single Male w/Child | 66 | 571 | 1,139 | |
Single Female w/Child | 167 | 1,237 | 3,093 |
Population Change Last Two Decades - Plus Projection
2000 | % | 2010 | % | 2020 | % | 2030 | |
---|---|---|---|---|---|---|---|
Illinois | 12,419,293 | +3 | 12,830,632 | +12 | 14,316,487 | +6 | 15,138,849 |
Cook County | 5,376,741 | -3 | 5,194,675 | +10 | 5,707,832 | +5 | 5,990,243 |
Kendall County | 54,544 | +110 | 114,736 | -31 | 78,694 | +8 | 85,060 |
Will County | 502,266 | +35 | 677,560 | +34 | 907,625 | +20 | 1,093,207 |
Total Working Age Population:
Total Households:
Total Working Age Population:
Total Households:
Total Working Age Population:
Total Households: