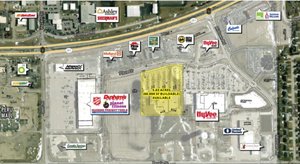
Space Available at Lockport Square:
Anchor & Inline Opportunities Available
Improved Outparcels Available for Sale/Lease
Shadow Anchored by Walmart & Jewel-Osco
Adjacent to I-355 Interchange (68K VPD)
Chrysler/Dodge/Jeep/Ram Dealership Opening 2021
Lockport is Headquarters to RJ Logistic, LG Electronics, and Julian Electric
5,576,000 sq ft of Industrial Parks along I-355 (Employs Approx 3,000 People)
506 New Homes Built in the Last Four Years
No part of this information may be copied, reproduced, repurposed, or screen-captured for any commercial purpose without prior written authorization from MyEListing.
While we strive to provide the most accurate information, all listing information, and demographic data, is provided by third-parties. As such, MyEListing will not be responsible for the accuracy of the information. It is strongly recommended that you verify all information with the listing agent, and any relevant agencies, prior to making any decisions.
What kind of Land is the propery at 3101 Lockport Rd?
The property at 3101 Lockport Rd Lockport, IL 60441 is listed as a Retail Pad Site Land property
What is the population within 1 mile of 3101 Lockport Rd in Lockport?
The population within 1 mile of 3101 Lockport Rd Lockport, IL 60441 is 3,217 people.
Who do I contact for questions about 3101 Lockport Rd?
You should contact the listing agent,
Gary Greenfield, for any details regarding this commercial listing.