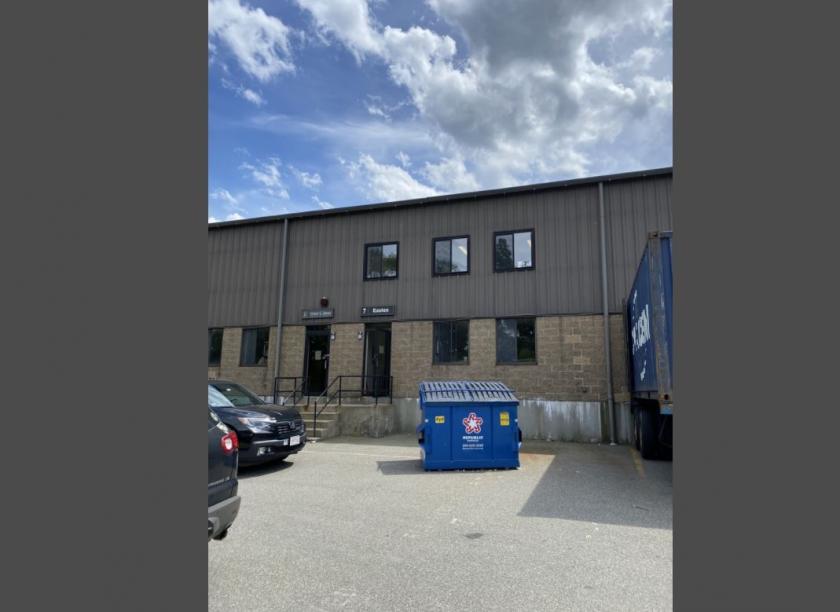
Industrial Properties
275 Centre Street Holbrook, MA 02343
275 Centre Street Holbrook, MA 02343

Details & Description
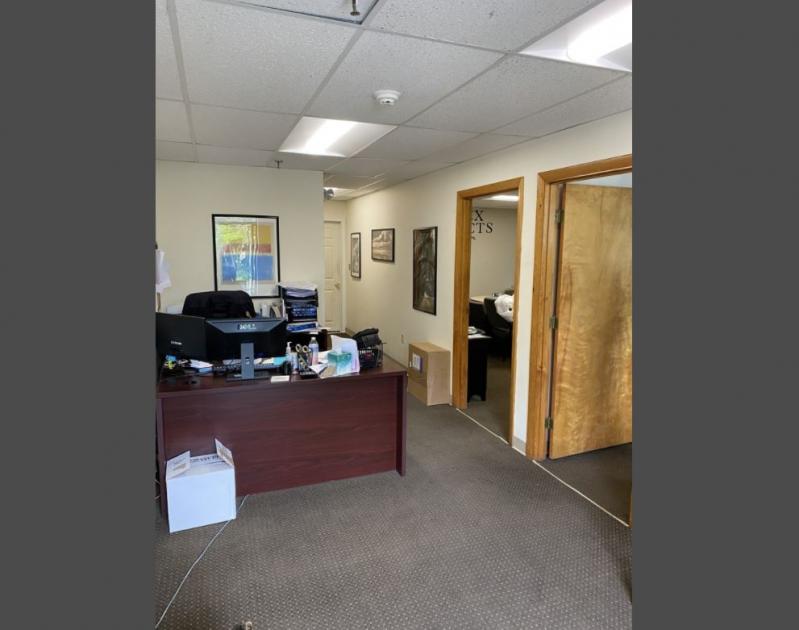
Additional Photos


Listing Agents

Dave Ellis
O: 617-640-7581
dave@ellisrealtyadvisors.com
O: 617-640-7581
dave@ellisrealtyadvisors.com
While we strive to provide the most accurate information, all listing information, and demographic data, is provided by third-parties. As such, MyEListing will not be responsible for the accuracy of the information. It is strongly recommended that you verify all information with the listing agent, and any relevant agencies, prior to making any decisions.


