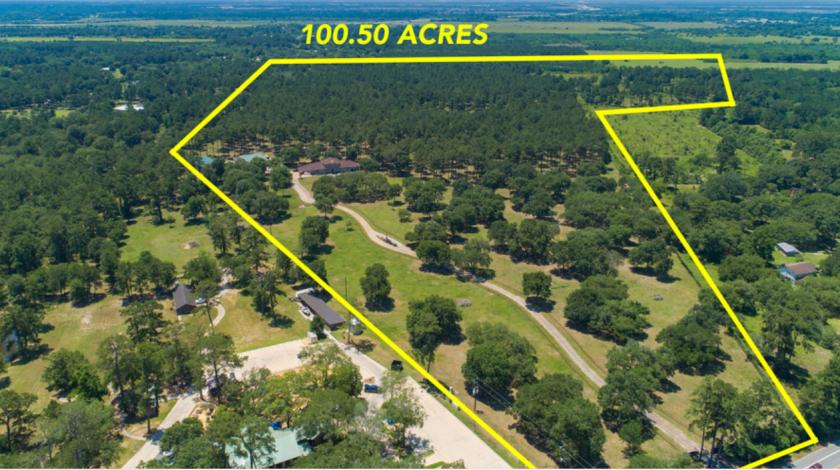
Gorgeous ± 100 acre property located in Hockley, Texas.
Highlights
Shown By Appointment Only
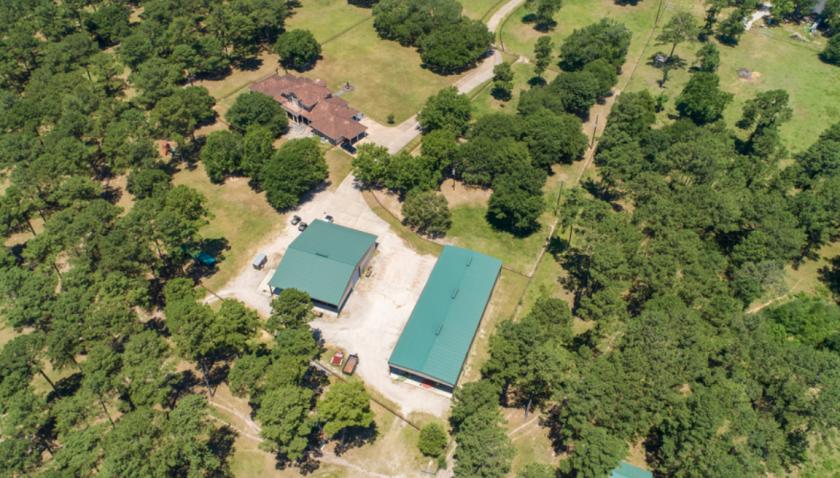
Beautiful ± 5,045 SF custom home on the property
6,250 SF Metal Barn (50’x125’), insulated roof and walls (built 2016)
4,200 SF Metal RV Garage, insulated roof and walls, High bay doors and (5) electrically operated roll up doors
262.72 feet of frontage on FM 2920
Adjacent to future proposed Master Planned Community
Waller ISD
No part of this information may be copied, reproduced, repurposed, or screen-captured for any commercial purpose without prior written authorization from MyEListing.
While we strive to provide the most accurate information, all listing information, and demographic data, is provided by third-parties. As such, MyEListing will not be responsible for the accuracy of the information. It is strongly recommended that you verify all information with the listing agent, and any relevant agencies, prior to making any decisions.
What is the asking price for 21745 Farm to Market 2920 in Hockley?
The asking price for 21745 Farm to Market 2920 is $6,200,000
How much land does the Hockley, TX property at 21745 Farm to Market 2920 include?
21745 Farm to Market 2920 in Hockley includes 100.000 acres of land
What kind of Land is the propery at 21745 Farm to Market 2920?
The property at 21745 Farm to Market 2920 Hockley, TX 77447 is listed as a Single Family Land Land property
What is the population within 1 mile of 21745 Farm to Market 2920 in Hockley?
The population within 1 mile of 21745 Farm to Market 2920 Hockley, TX 77447 is 797 people.
Who do I contact for questions about 21745 Farm to Market 2920?
You should contact the listing agent,
Clay Roper, for any details regarding this commercial listing.