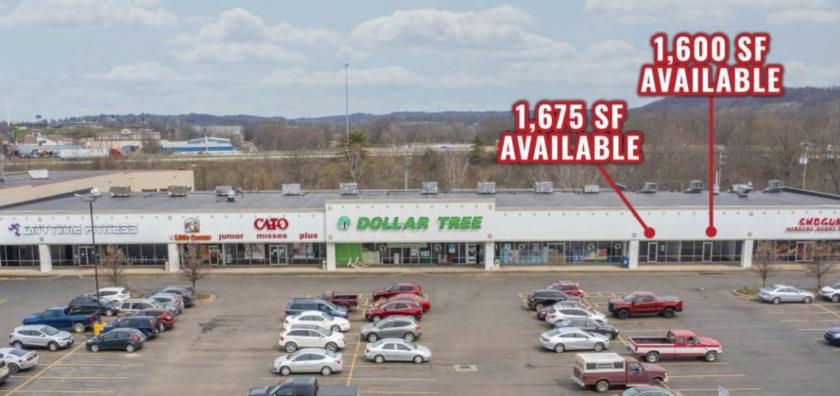
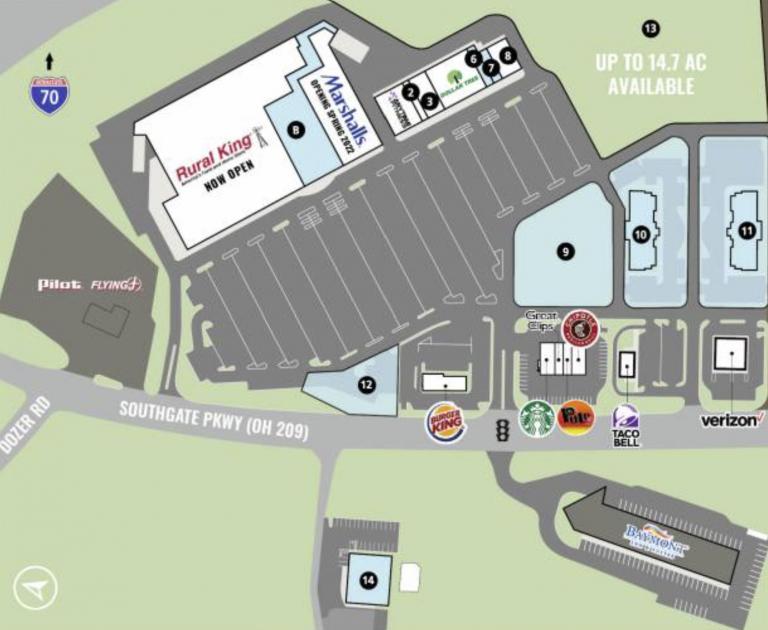
1-Mile | 3-Miles | 5-Miles | ||
---|---|---|---|---|
Total Population | 875 | 12,292 | 20,312 | |
Population Median Age | 41 | 38 | 39 | |
Population by Age | 0-9 Yrs | 88 (10%) | 1668 (13%) | 2727 (13%) |
10-19 Yrs | 86 (9%) | 1484 (12%) | 2477 (12%) | |
20-29 Yrs | 176 (20%) | 2076 (16%) | 2961 (14%) | |
30-39 Yrs | 61 (6%) | 1338 (10%) | 2339 (11%) | |
40-49 Yrs | 92 (10%) | 1320 (10%) | 2178 (10%) | |
50-59 Yrs | 148 (16%) | 1712 (13%) | 2799 (13%) | |
60-69 Yrs | 114 (13%) | 1425 (11%) | 2537 (12%) | |
70+ Yrs | 111 (12%) | 1268 (10%) | 2295 (11%) | |
Median HH Income | $29,418 | $34,951 | $38,466 | |
Total Household Income | < 24K | 179 (44%) | 1912 (36%) | 2913 (34%) |
25-49K | 108 (26%) | 1332 (25%) | 2194 (25%) | |
50-74K | 38 (9%) | 846 (16%) | 1478 (17%) | |
75-99K | 49 (12%) | 545 (10%) | 924 (10%) | |
100-199K | 29 (7%) | 520 (9%) | 860 (10%) | |
200K+ | 1 (0%) | 65 (1%) | 153 (1%) | |
Highest Education Level | No Diploma | 94 | 1100 | 1780 |
Diploma or GED | 371 | 3601 | 5941 | |
Some College | 118 | 1628 | 2884 | |
Assoc. Degree | 37 | 784 | 1276 | |
Bachelors Degree | 17 | 666 | 1139 | |
Higher Degree | 4 | 438 | 733 | |
Total Housing Units | 447 | 5,911 | 9,778 | |
--Owner-Occupied | 221 | 3,012 | 5,298 | |
--Renter-Occupied | 184 | 2,208 | 3,225 | |
Owner-Occupied Values | < 100K | 159 | 1812 | 2613 |
100-199K | 51 | 923 | 2003 | |
200-299K | 5 | 181 | 427 | |
300-399K | 3 | 26 | 76 | |
400-499K | 1 | 37 | 79 | |
500K+ | 2 | 33 | 99 | |
Total Working Age Population | 754 | 9,689 | 15,975 | |
In Work Force | 386 | 5,542 | 9,097 | |
Not In Work Force | 368 | 4,147 | 6,877 | |
Workforce Employed | 357 | 5,139 | 8,460 | |
Workforce Unemployed | 30 | 382 | 611 | |
Civlian Workforce | 386 | 5,521 | 9,071 | |
Military Workforce | 0 | 22 | 26 | |
Total Households | 405 | 5,220 | 8,524 | |
Family Households | 197 | 3,023 | 5,093 | |
Non-Family Households | 207 | 2,197 | 3,431 | |
Married Couple | 105 | 1,783 | 3,274 | |
Other Family | 93 | 1,241 | 1,818 | |
Married w/Child | 24 | 621 | 1,129 | |
Single Male w/Child | 0 | 128 | 195 | |
Single Female w/Child | 51 | 678 | 938 |
Population Change Last Two Decades - Plus Projection
2000 | % | 2010 | % | 2020 | % | 2030 | |
---|---|---|---|---|---|---|---|
Ohio | 11,353,140 | +2 | 11,536,504 | 0 | 11,574,870 | 0 | 11,615,100 |
Guernsey County | 40,792 | -2 | 40,087 | -3 | 38,750 | -4 | 37,310 |
Noble County | 14,058 | +4 | 14,645 | -5 | 13,960 | -1 | 13,790 |
Total Working Age Population:
Total Households:
Total Working Age Population:
Total Households:
Total Working Age Population:
Total Households: