Rare endcap opportunity on Sawmill Road
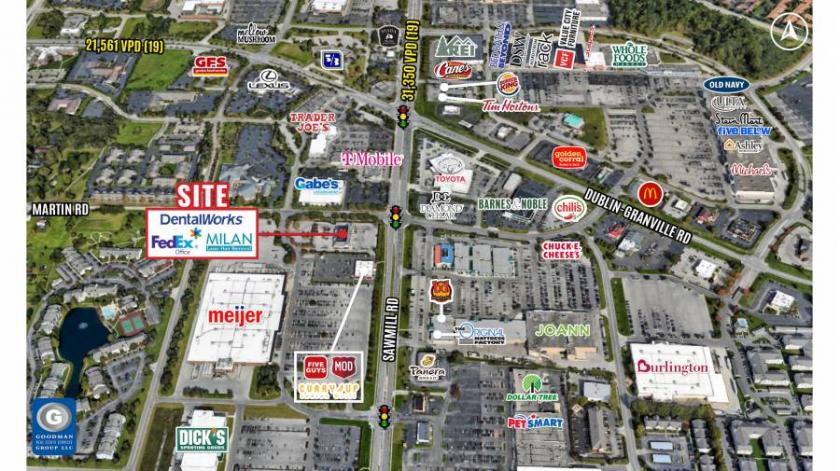
Sawmill Road is considered to be one of the top Columbus Metropolitan retail markets in the region
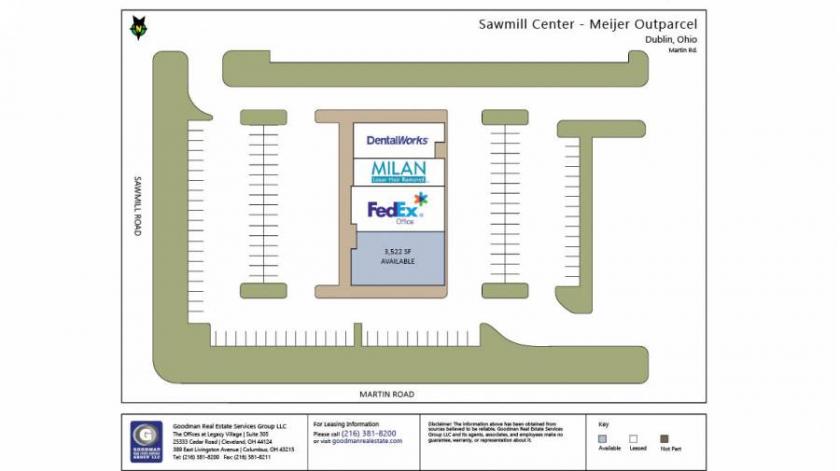
Located on the southwest corner of Sawmill and Martin Roads at an intersection with dedicated left turn signalization
Shadow anchored by Meijer
Co-tenants include FedEx Office, DentalWorks, and Milan Laser Hair Removal
Surrounded by many national retail/service industry businesses, including Target, Trader Joe’s, Whole Foods, and Home Depot
Give your business exposure to over 30,000 vehicles per day
AVAILABLE: 3,522 SF former restaurant
No part of this information may be copied, reproduced, repurposed, or screen-captured for any commercial purpose without prior written authorization from MyEListing.
While we strive to provide the most accurate information, all listing information, and demographic data, is provided by third-parties. As such, MyEListing will not be responsible for the accuracy of the information. It is strongly recommended that you verify all information with the listing agent, and any relevant agencies, prior to making any decisions.
What is the building size of this commercial Retail property?
The size of this lease property at '.6185 Sawmill Road.' is 3522 square feet
What kind of Retail is the propery at 6185 Sawmill Road?
The property at 6185 Sawmill Road Dublin, OH 43017 is listed as a Shopping Center Retail property
What is the population within 1 mile of 6185 Sawmill Road in Dublin?
The population within 1 mile of 6185 Sawmill Road Dublin, OH 43017 is 10,768 people.
Who do I contact for questions about 6185 Sawmill Road?
You should contact the listing agent,
Daniel Clark, for any details regarding this commercial listing.