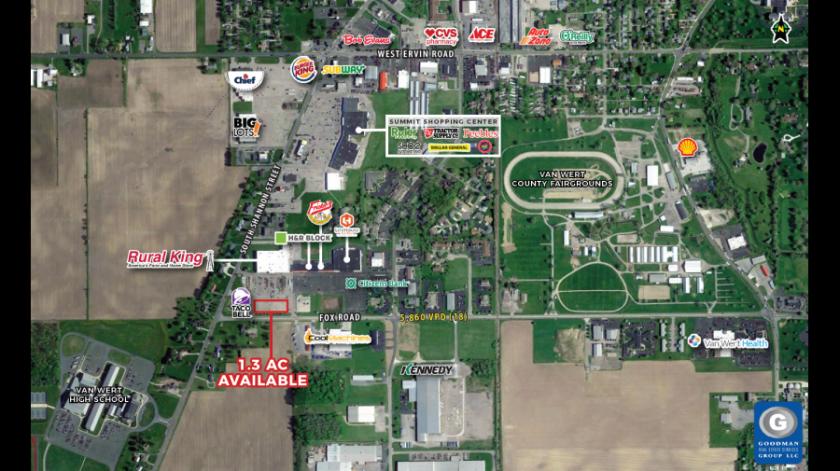
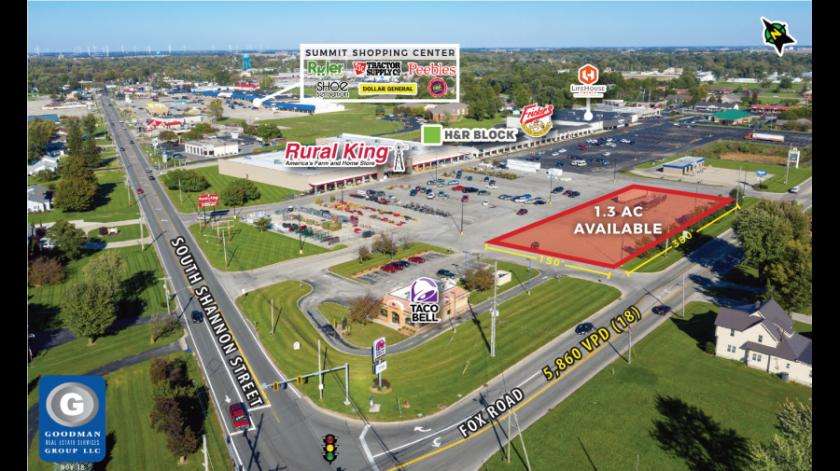
1-Mile | 3-Miles | 5-Miles | ||
---|---|---|---|---|
Total Population | 1,975 | 12,203 | 13,823 | |
Population Median Age | 43 | 40 | 41 | |
Population by Age | 0-9 Yrs | 271 (13%) | 1703 (13%) | 1904 (13%) |
10-19 Yrs | 205 (10%) | 1496 (12%) | 1663 (12%) | |
20-29 Yrs | 203 (10%) | 1390 (11%) | 1553 (11%) | |
30-39 Yrs | 190 (9%) | 1395 (11%) | 1567 (11%) | |
40-49 Yrs | 236 (11%) | 1483 (12%) | 1660 (12%) | |
50-59 Yrs | 267 (13%) | 1472 (12%) | 1728 (12%) | |
60-69 Yrs | 231 (11%) | 1483 (12%) | 1721 (12%) | |
70+ Yrs | 371 (18%) | 1780 (14%) | 2027 (14%) | |
Median HH Income | $40,154 | $46,687 | $48,931 | |
Total Household Income | < 24K | 228 (27%) | 1285 (25%) | 1375 (23%) |
25-49K | 286 (34%) | 1413 (27%) | 1553 (27%) | |
50-74K | 130 (15%) | 1035 (20%) | 1232 (21%) | |
75-99K | 73 (8%) | 671 (13%) | 757 (13%) | |
100-199K | 94 (11%) | 552 (10%) | 707 (12%) | |
200K+ | 14 (1%) | 95 (1%) | 112 (1%) | |
Highest Education Level | No Diploma | 165 | 780 | 879 |
Diploma or GED | 624 | 3586 | 4119 | |
Some College | 258 | 1632 | 1780 | |
Assoc. Degree | 93 | 740 | 881 | |
Bachelors Degree | 125 | 833 | 972 | |
Higher Degree | 105 | 684 | 808 | |
Total Housing Units | 898 | 5,569 | 6,286 | |
--Owner-Occupied | 528 | 3,476 | 4,091 | |
--Renter-Occupied | 297 | 1,575 | 1,646 | |
Owner-Occupied Values | < 100K | 275 | 1779 | 1942 |
100-199K | 204 | 1241 | 1561 | |
200-299K | 41 | 311 | 429 | |
300-399K | 3 | 89 | 91 | |
400-499K | 1 | 8 | 8 | |
500K+ | 5 | 49 | 60 | |
Total Working Age Population | 1,561 | 9,514 | 10,837 | |
In Work Force | 852 | 5,628 | 6,457 | |
Not In Work Force | 708 | 3,886 | 4,380 | |
Workforce Employed | 815 | 5,361 | 6,163 | |
Workforce Unemployed | 37 | 267 | 294 | |
Civlian Workforce | 852 | 5,628 | 6,457 | |
Military Workforce | 0 | 0 | 0 | |
Total Households | 826 | 5,050 | 5,737 | |
Family Households | 497 | 3,386 | 3,857 | |
Non-Family Households | 329 | 1,665 | 1,879 | |
Married Couple | 344 | 2,330 | 2,741 | |
Other Family | 153 | 1,056 | 1,116 | |
Married w/Child | 129 | 764 | 905 | |
Single Male w/Child | 24 | 251 | 280 | |
Single Female w/Child | 60 | 462 | 469 |
Population Change Last Two Decades - Plus Projection
2000 | % | 2010 | % | 2020 | % | 2030 | |
---|---|---|---|---|---|---|---|
Ohio | 11,353,140 | +2 | 11,536,504 | 0 | 11,574,870 | 0 | 11,615,100 |
Van Wert County | 29,659 | -3 | 28,744 | -4 | 27,620 | -5 | 26,190 |
Total Working Age Population:
Total Households:
Total Working Age Population:
Total Households:
Total Working Age Population:
Total Households: