Office Space
400 North Sam Houston Parkway East Houston, TX 77060
400 North Sam Houston Parkway East Houston, TX 77060

Details & Description
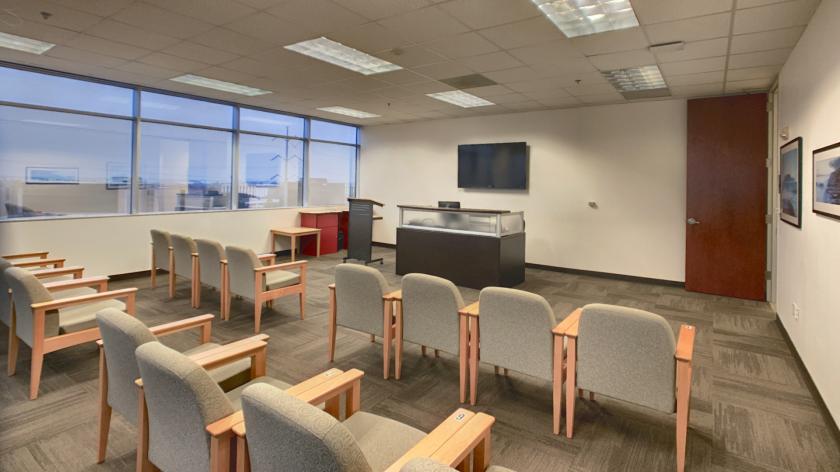
Additional Photos


Listing Agents

Sue Rogers
O: 713-402-5809
srogers@cresa.com
O: 713-402-5809
srogers@cresa.com
While we strive to provide the most accurate information, all listing information, and demographic data, is provided by third-parties. As such, MyEListing will not be responsible for the accuracy of the information. It is strongly recommended that you verify all information with the listing agent, and any relevant agencies, prior to making any decisions.


