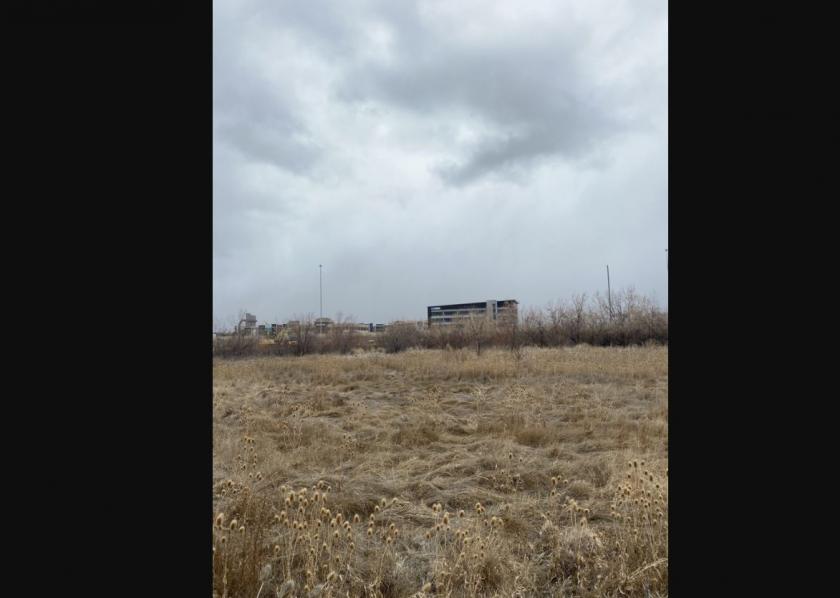
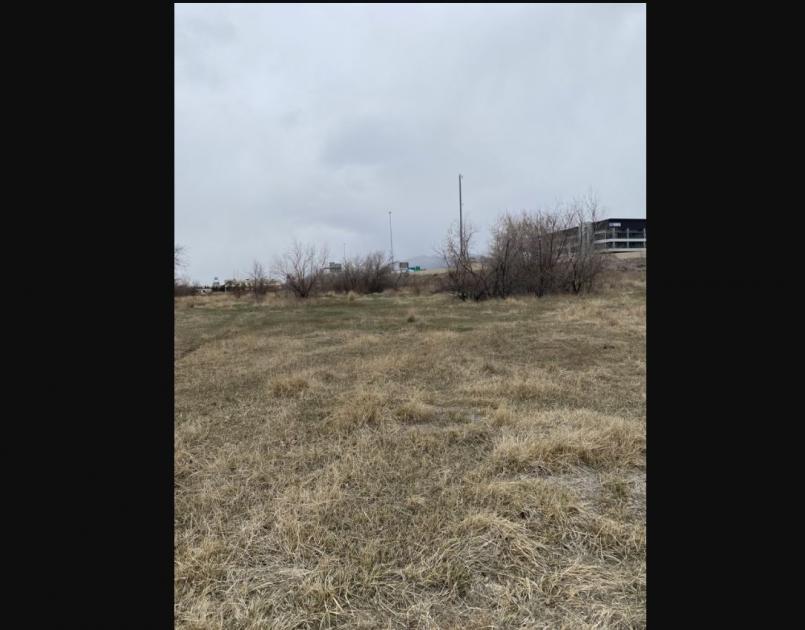
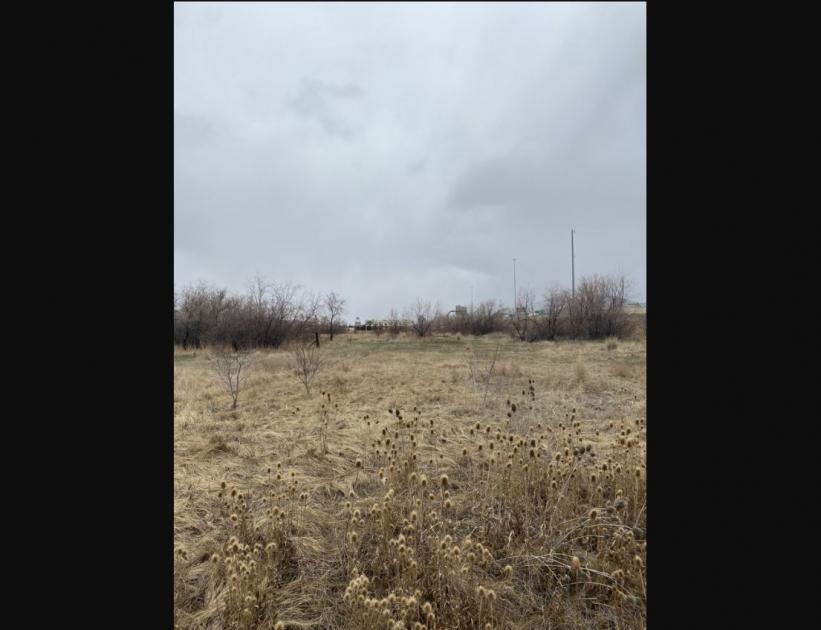
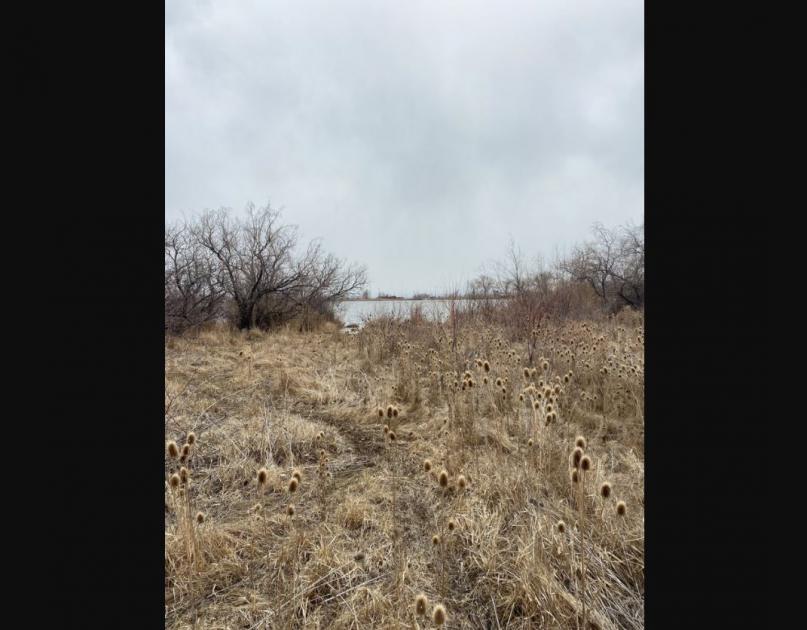
1-Mile | 3-Miles | 5-Miles | ||
---|---|---|---|---|
Total Population | 6,404 | 65,070 | 140,002 | |
Population Median Age | 31 | 30 | 30 | |
Population by Age | 0-9 Yrs | 1397 (21%) | 13693 (21%) | 29195 (20%) |
10-19 Yrs | 1154 (18%) | 13800 (21%) | 29710 (21%) | |
20-29 Yrs | 731 (11%) | 7539 (11%) | 17288 (12%) | |
30-39 Yrs | 940 (14%) | 9047 (13%) | 19655 (14%) | |
40-49 Yrs | 765 (11%) | 8212 (12%) | 18039 (12%) | |
50-59 Yrs | 574 (8%) | 5343 (8%) | 10845 (7%) | |
60-69 Yrs | 391 (6%) | 4004 (6%) | 8494 (6%) | |
70+ Yrs | 452 (7%) | 3432 (5%) | 6775 (4%) | |
Median HH Income | $78,776 | $89,240 | $91,682 | |
Total Household Income | < 24K | 146 (7%) | 1403 (8%) | 2588 (6%) |
25-49K | 323 (17%) | 2429 (14%) | 5786 (15%) | |
50-74K | 409 (22%) | 3115 (18%) | 6516 (17%) | |
75-99K | 294 (15%) | 2989 (17%) | 6200 (16%) | |
100-199K | 593 (32%) | 6053 (34%) | 13490 (35%) | |
200K+ | 79 (4%) | 1311 (7%) | 3475 (9%) | |
Highest Education Level | No Diploma | 139 | 1565 | 2571 |
Diploma or GED | 670 | 5479 | 10047 | |
Some College | 1007 | 8924 | 18616 | |
Assoc. Degree | 432 | 3692 | 7916 | |
Bachelors Degree | 943 | 9902 | 22837 | |
Higher Degree | 313 | 4233 | 10639 | |
Total Housing Units | 1,902 | 17,876 | 39,446 | |
--Owner-Occupied | 1,355 | 14,059 | 29,516 | |
--Renter-Occupied | 489 | 3,240 | 8,538 | |
Owner-Occupied Values | < 100K | 51 | 248 | 569 |
100-199K | 245 | 1538 | 2923 | |
200-299K | 451 | 4340 | 7991 | |
300-399K | 229 | 3611 | 7687 | |
400-499K | 229 | 2125 | 4826 | |
500K+ | 148 | 2199 | 5519 | |
Total Working Age Population | 4,321 | 42,732 | 91,967 | |
In Work Force | 2,950 | 28,529 | 62,676 | |
Not In Work Force | 1,371 | 14,203 | 29,292 | |
Workforce Employed | 2,819 | 27,366 | 60,317 | |
Workforce Unemployed | 121 | 1,059 | 2,191 | |
Civlian Workforce | 2,940 | 28,425 | 62,507 | |
Military Workforce | 10 | 104 | 168 | |
Total Households | 1,844 | 17,300 | 38,054 | |
Family Households | 1,567 | 15,030 | 32,513 | |
Non-Family Households | 277 | 2,270 | 5,541 | |
Married Couple | 1,367 | 13,444 | 28,725 | |
Other Family | 200 | 1,586 | 3,788 | |
Married w/Child | 782 | 8,161 | 17,665 | |
Single Male w/Child | 37 | 188 | 429 | |
Single Female w/Child | 61 | 460 | 1,339 |
Population Change Last Two Decades - Plus Projection
2000 | % | 2010 | % | 2020 | % | 2030 | |
---|---|---|---|---|---|---|---|
Utah | 2,233,169 | +24 | 2,763,885 | +20 | 3,325,425 | +17 | 3,889,310 |
Salt Lake County | 898,387 | +15 | 1,029,655 | +15 | 1,181,471 | +11 | 1,306,414 |
Utah County | 368,536 | +40 | 516,564 | +31 | 679,188 | +27 | 861,852 |
Total Working Age Population:
Total Households:
Total Working Age Population:
Total Households:
Total Working Age Population:
Total Households: