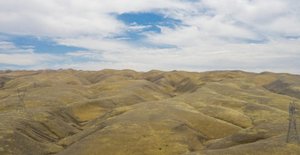
1-Mile | 3-Miles | 5-Miles | ||
---|---|---|---|---|
Total Population | 22 | 1,123 | 20,582 | |
Population Median Age | 46 | 42 | 40 | |
Population by Age | 0-9 Yrs | 2 (9%) | 100 (8%) | 2703 (13%) |
10-19 Yrs | 3 (13%) | 169 (15%) | 2385 (11%) | |
20-29 Yrs | 1 (4%) | 61 (5%) | 1988 (9%) | |
30-39 Yrs | 3 (13%) | 145 (12%) | 2905 (14%) | |
40-49 Yrs | 3 (13%) | 169 (15%) | 2781 (13%) | |
50-59 Yrs | 4 (18%) | 226 (20%) | 3666 (17%) | |
60-69 Yrs | 5 (22%) | 162 (14%) | 2032 (9%) | |
70+ Yrs | 2 (9%) | 91 (8%) | 2123 (10%) | |
Median HH Income | $123,294 | $199,953 | $147,605 | |
Total Household Income | < 24K | 0 (0%) | 14 (3%) | 460 (6%) |
25-49K | 1 (14%) | 25 (7%) | 562 (7%) | |
50-74K | 1 (14%) | 28 (7%) | 622 (8%) | |
75-99K | 1 (14%) | 10 (2%) | 582 (8%) | |
100-199K | 2 (28%) | 99 (27%) | 2804 (39%) | |
200K+ | 2 (28%) | 177 (49%) | 2090 (29%) | |
Highest Education Level | No Diploma | 1 | 39 | 718 |
Diploma or GED | 5 | 146 | 2498 | |
Some College | 3 | 130 | 3102 | |
Assoc. Degree | 2 | 86 | 1640 | |
Bachelors Degree | 4 | 258 | 3905 | |
Higher Degree | 3 | 170 | 2770 | |
Total Housing Units | 7 | 386 | 7,386 | |
--Owner-Occupied | 5 | 327 | 5,435 | |
--Renter-Occupied | 2 | 28 | 1,685 | |
Owner-Occupied Values | < 100K | 0 | 10 | 38 |
100-199K | 0 | 1 | 49 | |
200-299K | 1 | 8 | 91 | |
300-399K | 0 | 7 | 128 | |
400-499K | 0 | 9 | 187 | |
500K+ | 4 | 292 | 4943 | |
Total Working Age Population | 17 | 913 | 16,365 | |
In Work Force | 12 | 603 | 11,354 | |
Not In Work Force | 6 | 310 | 5,011 | |
Workforce Employed | 11 | 573 | 11,029 | |
Workforce Unemployed | 1 | 30 | 302 | |
Civlian Workforce | 12 | 603 | 11,331 | |
Military Workforce | 0 | 0 | 23 | |
Total Households | 7 | 355 | 7,120 | |
Family Households | 5 | 305 | 5,505 | |
Non-Family Households | 2 | 49 | 1,615 | |
Married Couple | 4 | 287 | 4,742 | |
Other Family | 0 | 18 | 763 | |
Married w/Child | 2 | 116 | 2,054 | |
Single Male w/Child | 0 | 0 | 88 | |
Single Female w/Child | 0 | 7 | 166 |
Population Change Last Two Decades - Plus Projection
2000 | % | 2010 | % | 2020 | % | 2030 | |
---|---|---|---|---|---|---|---|
California | 33,871,648 | +10 | 37,253,956 | +9 | 40,467,295 | +8 | 43,631,295 |
Alameda County | 1,443,741 | +5 | 1,510,271 | +12 | 1,696,752 | +10 | 1,861,027 |
Contra Costa County | 948,816 | +11 | 1,049,025 | +12 | 1,171,305 | +11 | 1,296,786 |
San Joaquin County | 563,598 | +22 | 685,306 | +14 | 780,750 | +14 | 889,779 |
Total Working Age Population:
Total Households:
Total Working Age Population:
Total Households:
Total Working Age Population:
Total Households: