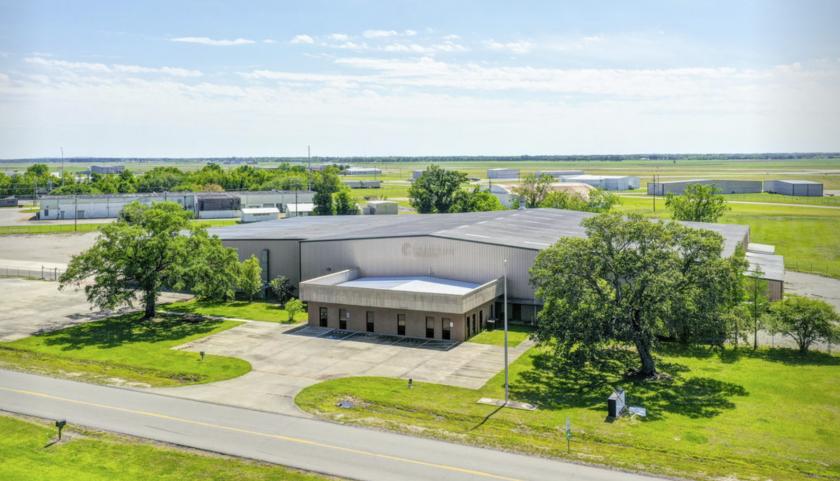
Industrial Properties
4919 West Admiral Doyle Drive New Iberia, LA 70560
4919 West Admiral Doyle Drive New Iberia, LA 70560
Details & Description
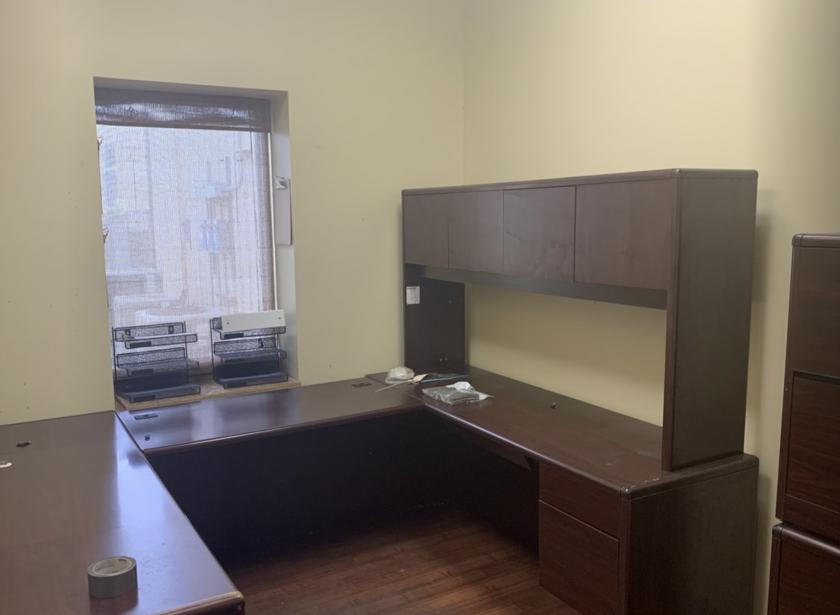
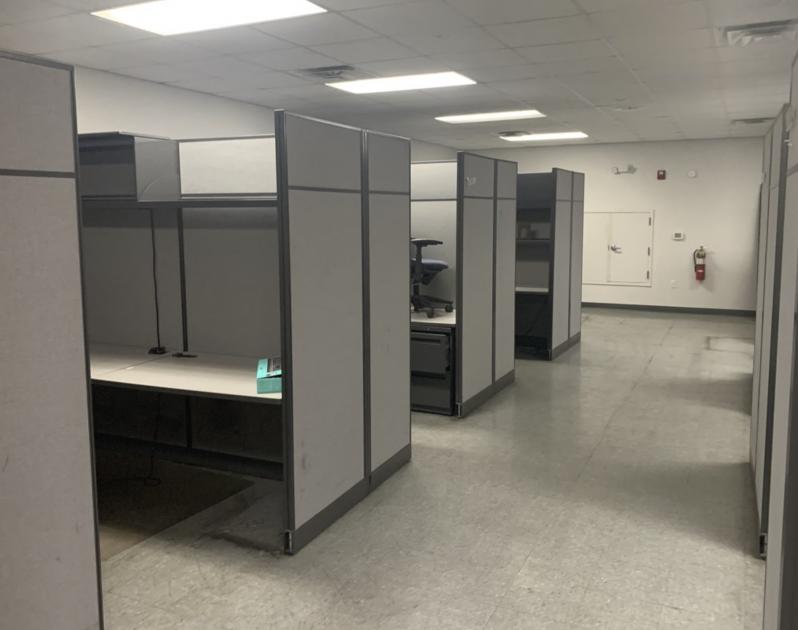
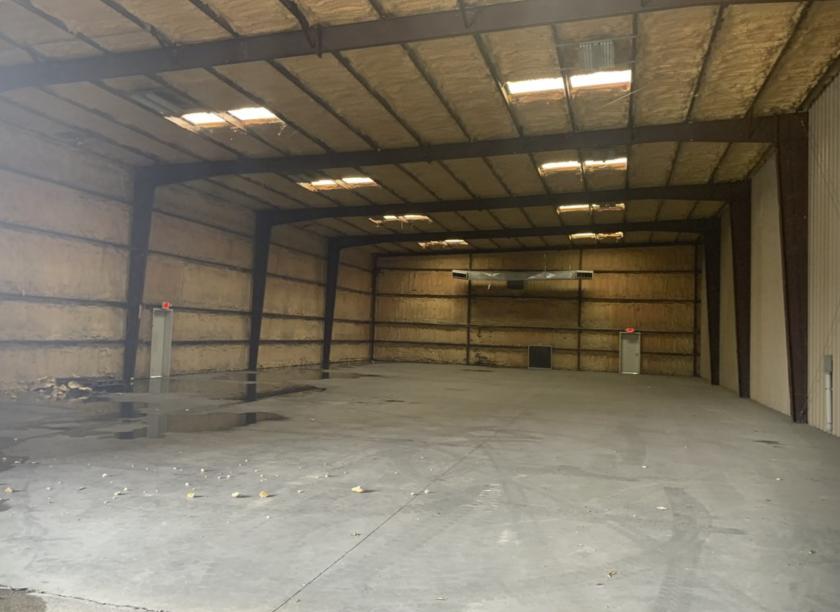
Additional Photos

Listing Agents

Brennan Billeaud
O: 337-233-9541
M: 337-654-2591
brennan@bbilleaud.com
O: 337-233-9541
M: 337-654-2591
brennan@bbilleaud.com
While we strive to provide the most accurate information, all listing information, and demographic data, is provided by third-parties. As such, MyEListing will not be responsible for the accuracy of the information. It is strongly recommended that you verify all information with the listing agent, and any relevant agencies, prior to making any decisions.


