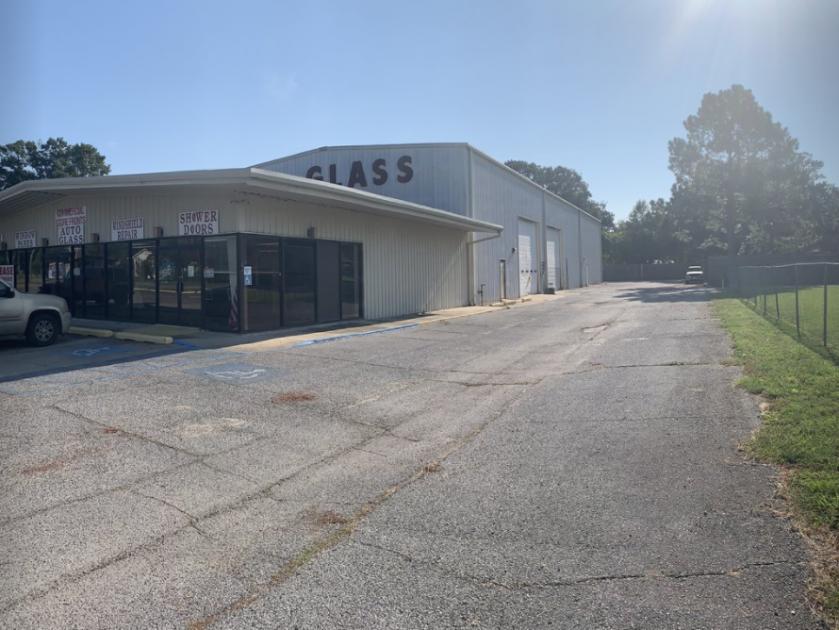
1-Mile | 3-Miles | 5-Miles | ||
---|---|---|---|---|
Total Population | 11,710 | 61,636 | 125,258 | |
Population Median Age | 34 | 36 | 37 | |
Population by Age | 0-9 Yrs | 1814 (15%) | 7280 (11%) | 15466 (12%) |
10-19 Yrs | 1752 (14%) | 8756 (14%) | 15961 (12%) | |
20-29 Yrs | 2103 (17%) | 12893 (20%) | 22003 (17%) | |
30-39 Yrs | 1641 (14%) | 8342 (13%) | 17028 (13%) | |
40-49 Yrs | 1220 (10%) | 5882 (9%) | 13635 (10%) | |
50-59 Yrs | 1231 (10%) | 6914 (11%) | 15193 (12%) | |
60-69 Yrs | 1084 (9%) | 6504 (10%) | 14646 (11%) | |
70+ Yrs | 865 (7%) | 5064 (8%) | 11326 (9%) | |
Median HH Income | $27,896 | $36,051 | $44,565 | |
Total Household Income | < 24K | 1853 (44%) | 8539 (36%) | 14871 (30%) |
25-49K | 1189 (28%) | 6251 (26%) | 11623 (23%) | |
50-74K | 548 (13%) | 3628 (15%) | 7940 (16%) | |
75-99K | 230 (5%) | 2044 (8%) | 5119 (10%) | |
100-199K | 245 (5%) | 2184 (9%) | 7144 (14%) | |
200K+ | 87 (2%) | 775 (3%) | 2447 (4%) | |
Highest Education Level | No Diploma | 1886 | 6380 | 10629 |
Diploma or GED | 2339 | 12511 | 25256 | |
Some College | 1335 | 7828 | 16770 | |
Assoc. Degree | 318 | 1737 | 3981 | |
Bachelors Degree | 1010 | 6917 | 18005 | |
Higher Degree | 339 | 3279 | 8382 | |
Total Housing Units | 4,577 | 27,105 | 55,732 | |
--Owner-Occupied | 1,740 | 11,010 | 27,191 | |
--Renter-Occupied | 2,413 | 12,411 | 21,952 | |
Owner-Occupied Values | < 100K | 771 | 3420 | 5586 |
100-199K | 557 | 4297 | 11540 | |
200-299K | 296 | 1815 | 5652 | |
300-399K | 93 | 663 | 1891 | |
400-499K | 11 | 240 | 795 | |
500K+ | 13 | 574 | 1727 | |
Total Working Age Population | 8,779 | 49,812 | 100,672 | |
In Work Force | 5,040 | 30,704 | 63,647 | |
Not In Work Force | 3,739 | 19,108 | 37,025 | |
Workforce Employed | 4,702 | 28,674 | 60,037 | |
Workforce Unemployed | 338 | 2,020 | 3,594 | |
Civlian Workforce | 5,040 | 30,694 | 63,631 | |
Military Workforce | 0 | 10 | 16 | |
Total Households | 4,152 | 23,421 | 49,143 | |
Family Households | 2,303 | 12,014 | 27,629 | |
Non-Family Households | 1,849 | 11,406 | 21,514 | |
Married Couple | 959 | 6,364 | 17,533 | |
Other Family | 1,344 | 5,650 | 10,097 | |
Married w/Child | 325 | 1,929 | 6,540 | |
Single Male w/Child | 54 | 392 | 985 | |
Single Female w/Child | 760 | 2,764 | 4,655 |
Population Change Last Two Decades - Plus Projection
2000 | % | 2010 | % | 2020 | % | 2030 | |
---|---|---|---|---|---|---|---|
Louisiana | 4,468,976 | +1 | 4,533,372 | +1 | 4,588,310 | +5 | 4,813,420 |
Lafayette Parish | 190,503 | +16 | 221,578 | -2 | 216,520 | +2 | 221,600 |
St. Landry Parish | 87,700 | -5 | 83,384 | +15 | 95,890 | +2 | 98,080 |
St. Martin Parish | 48,583 | +7 | 52,160 | +6 | 55,520 | +3 | 57,000 |
Total Working Age Population:
Total Households:
Total Working Age Population:
Total Households:
Total Working Age Population:
Total Households: