Office Space
3502 Woodview Trace Indianapolis, IN 46268
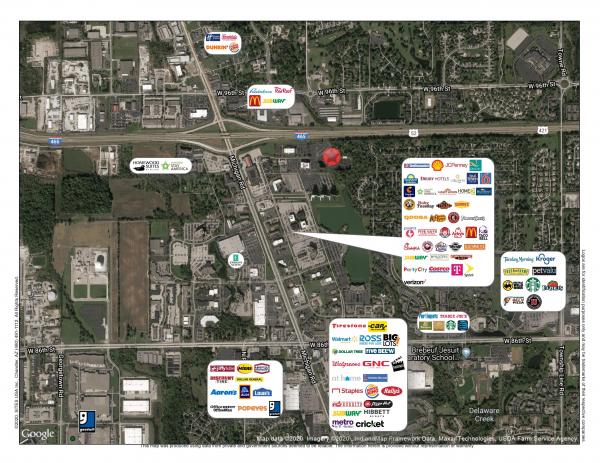
3502 Woodview Trace Indianapolis, IN 46268

Details & Description
Property Highlights
- • Class A headquarters building
- • On-site workout facility
- • Abundant amenities nearby
- • Free surface parking
Additional Photos


Listing Agents

Jeffrey Harris
O: 317-566-5610
M: 317-331-8888
jharris@cressy.com
O: 317-566-5610
M: 317-331-8888
jharris@cressy.com
While we strive to provide the most accurate information, all listing information, and demographic data, is provided by third-parties. As such, MyEListing will not be responsible for the accuracy of the information. It is strongly recommended that you verify all information with the listing agent, and any relevant agencies, prior to making any decisions.


