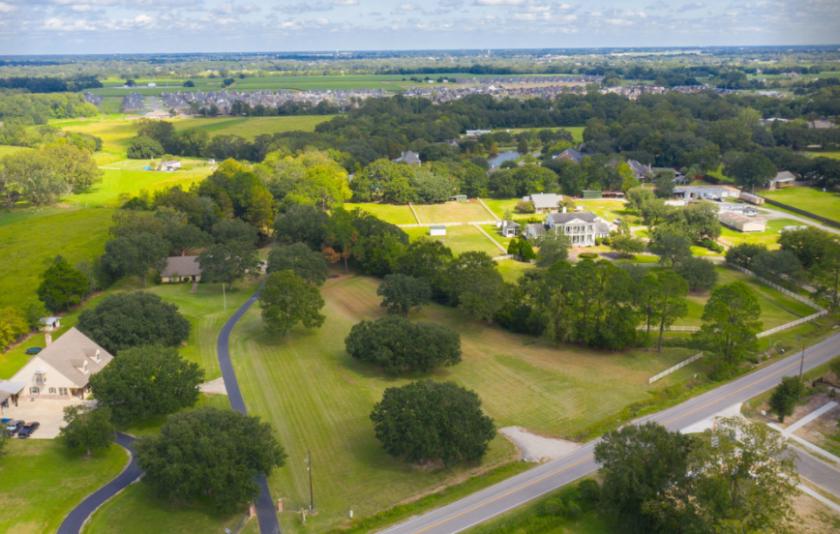
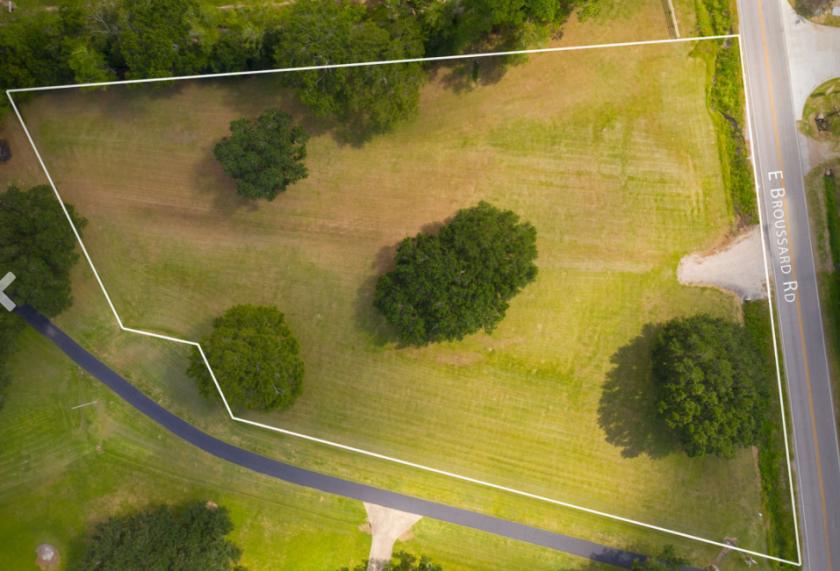
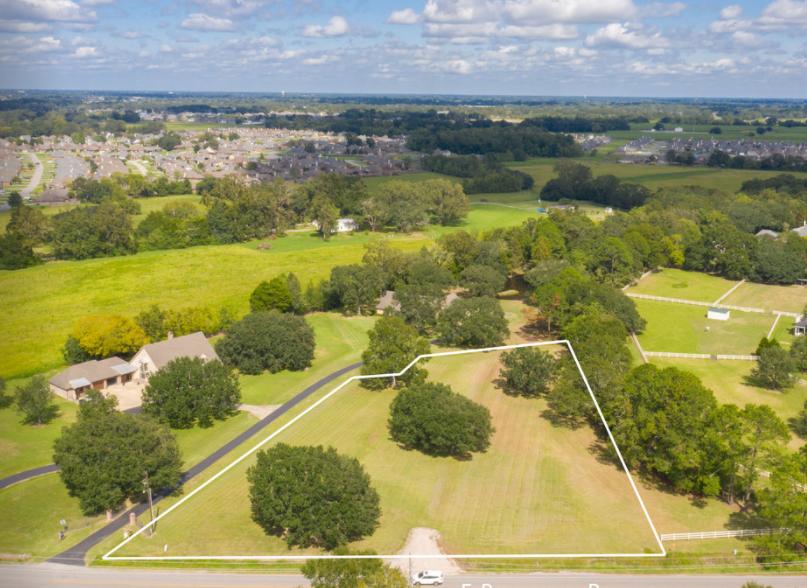
1-Mile | 3-Miles | 5-Miles | ||
---|---|---|---|---|
Total Population | 2,560 | 27,205 | 77,722 | |
Population Median Age | 35 | 36 | 37 | |
Population by Age | 0-9 Yrs | 362 (14%) | 3840 (14%) | 10924 (14%) |
10-19 Yrs | 409 (15%) | 3823 (14%) | 9730 (12%) | |
20-29 Yrs | 258 (10%) | 3195 (11%) | 9790 (12%) | |
30-39 Yrs | 451 (17%) | 4506 (16%) | 12842 (16%) | |
40-49 Yrs | 403 (15%) | 3661 (13%) | 9813 (12%) | |
50-59 Yrs | 341 (13%) | 3490 (12%) | 9861 (12%) | |
60-69 Yrs | 239 (9%) | 2813 (10%) | 8780 (11%) | |
70+ Yrs | 96 (3%) | 1878 (6%) | 5982 (7%) | |
Median HH Income | $109,759 | $93,467 | $79,120 | |
Total Household Income | < 24K | 86 (9%) | 1229 (12%) | 4151 (14%) |
25-49K | 109 (12%) | 1490 (15%) | 4860 (16%) | |
50-74K | 77 (8%) | 1328 (13%) | 4988 (17%) | |
75-99K | 124 (13%) | 1228 (12%) | 3962 (13%) | |
100-199K | 412 (45%) | 3271 (33%) | 7913 (27%) | |
200K+ | 90 (10%) | 1362 (13%) | 3430 (11%) | |
Highest Education Level | No Diploma | 72 | 1222 | 3695 |
Diploma or GED | 416 | 4526 | 13276 | |
Some College | 326 | 3652 | 10713 | |
Assoc. Degree | 148 | 1072 | 2911 | |
Bachelors Degree | 530 | 5579 | 15723 | |
Higher Degree | 193 | 2215 | 6858 | |
Total Housing Units | 958 | 10,888 | 31,942 | |
--Owner-Occupied | 820 | 8,029 | 21,537 | |
--Renter-Occupied | 79 | 1,879 | 7,767 | |
Owner-Occupied Values | < 100K | 75 | 783 | 1810 |
100-199K | 223 | 1994 | 6921 | |
200-299K | 339 | 2608 | 6473 | |
300-399K | 36 | 1270 | 2849 | |
400-499K | 56 | 634 | 1384 | |
500K+ | 91 | 740 | 2099 | |
Total Working Age Population | 1,909 | 20,771 | 60,544 | |
In Work Force | 1,476 | 14,490 | 41,872 | |
Not In Work Force | 433 | 6,280 | 18,672 | |
Workforce Employed | 1,432 | 14,020 | 40,099 | |
Workforce Unemployed | 44 | 431 | 1,695 | |
Civlian Workforce | 1,476 | 14,451 | 41,794 | |
Military Workforce | 0 | 39 | 78 | |
Total Households | 899 | 9,908 | 29,303 | |
Family Households | 699 | 7,373 | 20,385 | |
Non-Family Households | 200 | 2,535 | 8,919 | |
Married Couple | 544 | 6,002 | 16,228 | |
Other Family | 155 | 1,371 | 4,157 | |
Married w/Child | 340 | 2,890 | 7,446 | |
Single Male w/Child | 29 | 217 | 702 | |
Single Female w/Child | 74 | 610 | 1,816 |
Population Change Last Two Decades - Plus Projection
2000 | % | 2010 | % | 2020 | % | 2030 | |
---|---|---|---|---|---|---|---|
Louisiana | 4,468,976 | +1 | 4,533,372 | +1 | 4,588,310 | +5 | 4,813,420 |
Acadia Parish | 58,861 | +5 | 61,773 | -3 | 60,200 | -1 | 59,590 |
Iberia Parish | 73,266 | 0 | 73,240 | +4 | 76,150 | -1 | 75,450 |
Lafayette Parish | 190,503 | +16 | 221,578 | -2 | 216,520 | +2 | 221,600 |
St. Martin Parish | 48,583 | +7 | 52,160 | +6 | 55,520 | +3 | 57,000 |
Vermilion Parish | 53,807 | +8 | 57,999 | +2 | 58,930 | +2 | 60,150 |
Total Working Age Population:
Total Households:
Total Working Age Population:
Total Households:
Total Working Age Population:
Total Households: