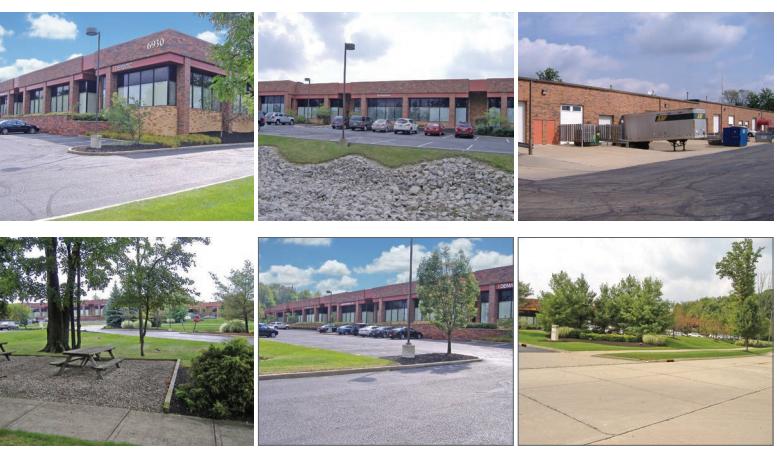
Office Space
6955 Treeline Drive Brecksville, OH 44141
6955 Treeline Drive Brecksville, OH 44141
Details & Description
Property Highlights
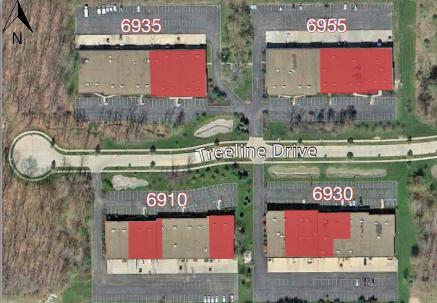
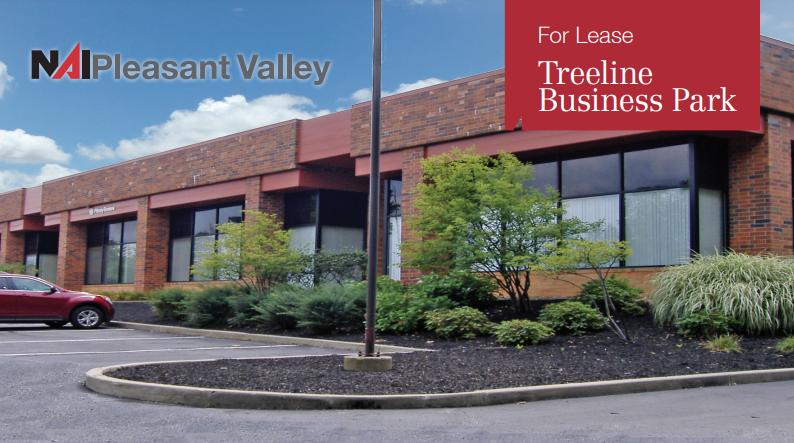
- • Treeline Business Park
- • Immediately off Brecksville Road
- • Close proximity to I-77
Listing Agents

Debbie Maggard
O: 216-455-0914
M: 216-496-3777
dmaggard@naipvc.com
O: 216-455-0914
M: 216-496-3777
dmaggard@naipvc.com
While we strive to provide the most accurate information, all listing information, and demographic data, is provided by third-parties. As such, MyEListing will not be responsible for the accuracy of the information. It is strongly recommended that you verify all information with the listing agent, and any relevant agencies, prior to making any decisions.