Flex-Office-Warehouse
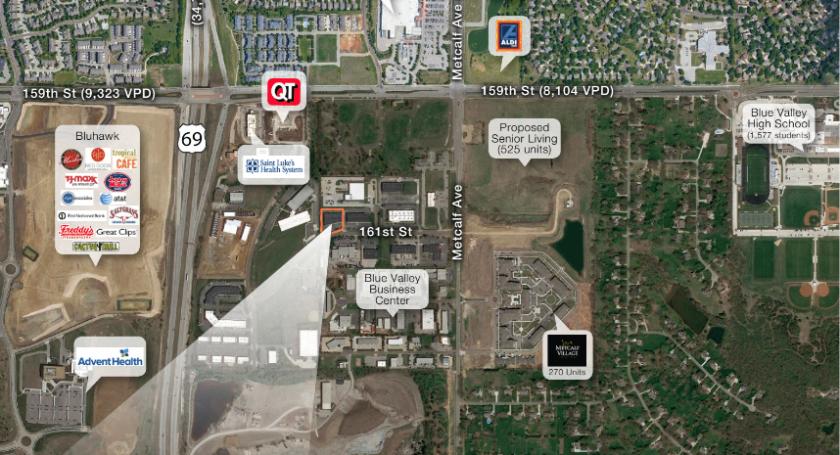
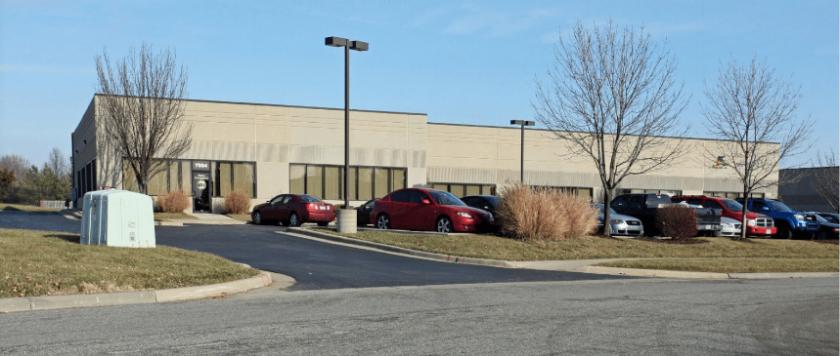
7504 West 161st Street Stilwell, KS 66085
7504 West 161st Street Stilwell, KS 66085
Details & Description
Listing Agents

Michael Sonnenberg
O: 913-956-5812
M: 816-500-5153
mike@nai-heartland.com
O: 913-956-5812
M: 816-500-5153
mike@nai-heartland.com
While we strive to provide the most accurate information, all listing information, and demographic data, is provided by third-parties. As such, MyEListing will not be responsible for the accuracy of the information. It is strongly recommended that you verify all information with the listing agent, and any relevant agencies, prior to making any decisions.