Industrial Properties
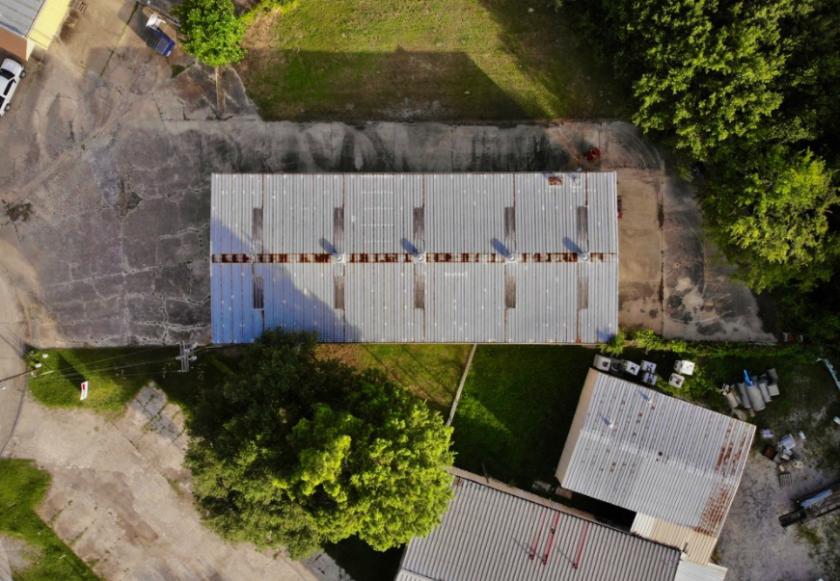
10471 Mammoth Avenue Baton Rouge, LA 70814
10471 Mammoth Avenue Baton Rouge, LA 70814

Details & Description
Listing Agents

Will Watson
O: 225-295-0800
M: 318-914-1576
willwatson@latterblum.com
O: 225-295-0800
M: 318-914-1576
willwatson@latterblum.com

Brennan Hammett
NAI Latter & Blum
O: 225-295-0800
M: 225-620-5690
brennanh@latterblum.com
NAI Latter & Blum
O: 225-295-0800
M: 225-620-5690
brennanh@latterblum.com
While we strive to provide the most accurate information, all listing information, and demographic data, is provided by third-parties. As such, MyEListing will not be responsible for the accuracy of the information. It is strongly recommended that you verify all information with the listing agent, and any relevant agencies, prior to making any decisions.