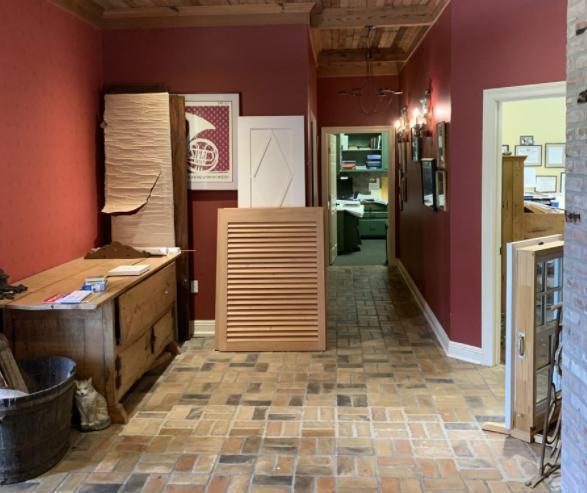
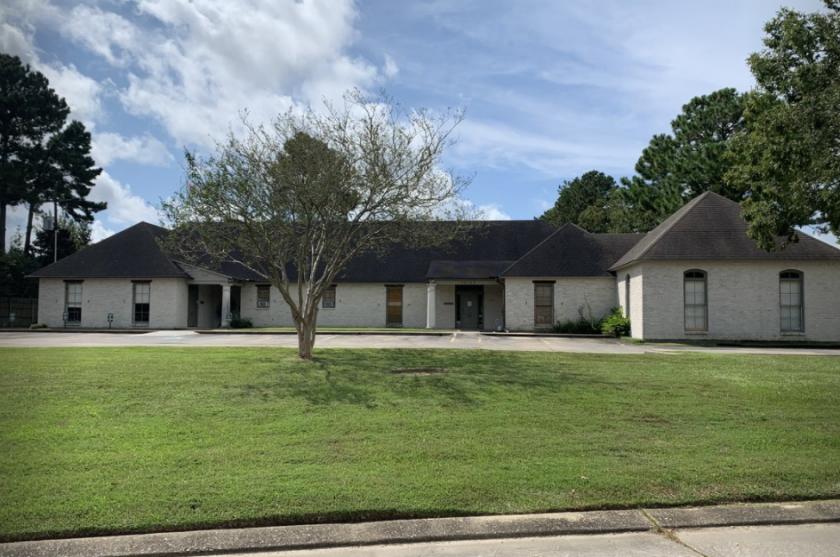
1-Mile | 3-Miles | 5-Miles | ||
---|---|---|---|---|
Total Population | 7,719 | 57,941 | 128,865 | |
Population Median Age | 40 | 38 | 38 | |
Population by Age | 0-9 Yrs | 716 (9%) | 7204 (12%) | 14022 (10%) |
10-19 Yrs | 787 (10%) | 6003 (10%) | 13991 (10%) | |
20-29 Yrs | 1368 (17%) | 11577 (19%) | 29247 (22%) | |
30-39 Yrs | 1098 (14%) | 7632 (13%) | 16901 (13%) | |
40-49 Yrs | 938 (12%) | 6754 (11%) | 14363 (11%) | |
50-59 Yrs | 1032 (13%) | 6611 (11%) | 13532 (10%) | |
60-69 Yrs | 1052 (13%) | 6664 (11%) | 14372 (11%) | |
70+ Yrs | 727 (9%) | 5496 (9%) | 12437 (9%) | |
Median HH Income | $76,952 | $74,834 | $69,383 | |
Total Household Income | < 24K | 326 (9%) | 3413 (14%) | 9418 (17%) |
25-49K | 616 (18%) | 4404 (19%) | 10160 (19%) | |
50-74K | 718 (21%) | 3773 (16%) | 8316 (15%) | |
75-99K | 451 (13%) | 3054 (13%) | 6326 (12%) | |
100-199K | 880 (25%) | 5993 (25%) | 12638 (24%) | |
200K+ | 399 (11%) | 2495 (10%) | 5504 (10%) | |
Highest Education Level | No Diploma | 334 | 2208 | 4279 |
Diploma or GED | 677 | 6775 | 15805 | |
Some College | 1124 | 7896 | 17254 | |
Assoc. Degree | 179 | 1964 | 4251 | |
Bachelors Degree | 1511 | 11039 | 24690 | |
Higher Degree | 1543 | 8530 | 17200 | |
Total Housing Units | 3,978 | 27,086 | 61,242 | |
--Owner-Occupied | 2,295 | 14,456 | 29,756 | |
--Renter-Occupied | 1,094 | 8,676 | 22,606 | |
Owner-Occupied Values | < 100K | 36 | 460 | 1299 |
100-199K | 824 | 4343 | 8173 | |
200-299K | 427 | 3915 | 8405 | |
300-399K | 595 | 2844 | 4938 | |
400-499K | 169 | 1022 | 2487 | |
500K+ | 243 | 1872 | 4454 | |
Total Working Age Population | 6,579 | 46,817 | 106,861 | |
In Work Force | 4,430 | 32,187 | 73,085 | |
Not In Work Force | 2,149 | 14,630 | 33,777 | |
Workforce Employed | 4,351 | 31,100 | 70,478 | |
Workforce Unemployed | 75 | 1,048 | 2,515 | |
Civlian Workforce | 4,426 | 32,148 | 72,993 | |
Military Workforce | 4 | 39 | 92 | |
Total Households | 3,389 | 23,133 | 52,362 | |
Family Households | 1,802 | 13,143 | 28,162 | |
Non-Family Households | 1,587 | 9,990 | 24,200 | |
Married Couple | 1,405 | 9,881 | 21,251 | |
Other Family | 397 | 3,262 | 6,911 | |
Married w/Child | 434 | 3,907 | 7,933 | |
Single Male w/Child | 59 | 419 | 913 | |
Single Female w/Child | 92 | 1,272 | 2,568 |
Population Change Last Two Decades - Plus Projection
2000 | % | 2010 | % | 2020 | % | 2030 | |
---|---|---|---|---|---|---|---|
Louisiana | 4,468,976 | +1 | 4,533,372 | +1 | 4,588,310 | +5 | 4,813,420 |
Ascension Parish | 76,627 | +40 | 107,215 | +38 | 147,740 | +33 | 196,140 |
East Baton Rouge Parish | 412,852 | +7 | 440,171 | -3 | 426,380 | -1 | 421,500 |
Iberville Parish | 33,320 | 0 | 33,387 | -17 | 27,830 | -11 | 24,640 |
St. Martin Parish | 48,583 | +7 | 52,160 | +6 | 55,520 | +3 | 57,000 |
West Baton Rouge Parish | 21,601 | +10 | 23,788 | -7 | 22,220 | -5 | 21,070 |
Total Working Age Population:
Total Households:
Total Working Age Population:
Total Households:
Total Working Age Population:
Total Households: