Industrial Properties
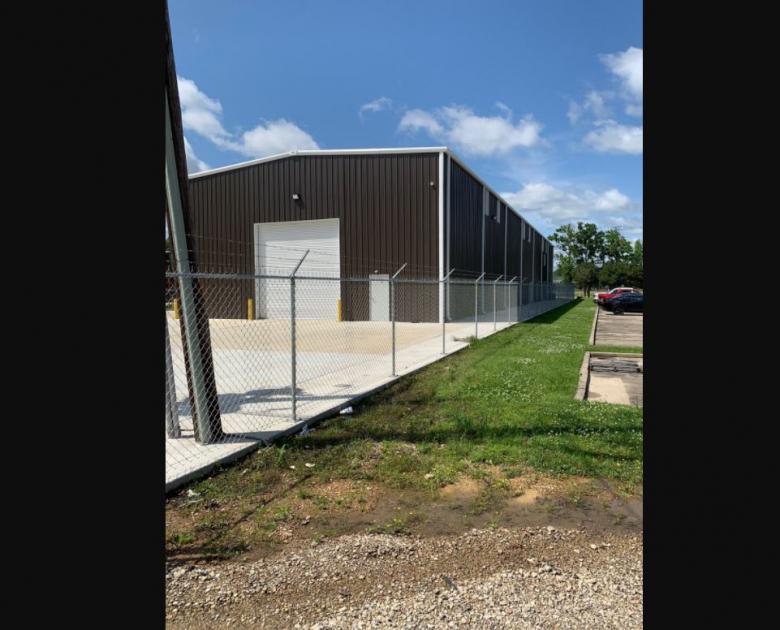
8836 South Choctaw Drive Baton Rouge, LA 70815
8836 South Choctaw Drive Baton Rouge, LA 70815
Details & Description
Additional Photos


Listing Agents

Clay Johnston
O: 225-295-0800
M: 225-229-1495
cjohnston@latterblum.com
O: 225-295-0800
M: 225-229-1495
cjohnston@latterblum.com

Bobby Smith
O: 225-295-0800
bobsmith@latterblum.com
O: 225-295-0800
bobsmith@latterblum.com
While we strive to provide the most accurate information, all listing information, and demographic data, is provided by third-parties. As such, MyEListing will not be responsible for the accuracy of the information. It is strongly recommended that you verify all information with the listing agent, and any relevant agencies, prior to making any decisions.


