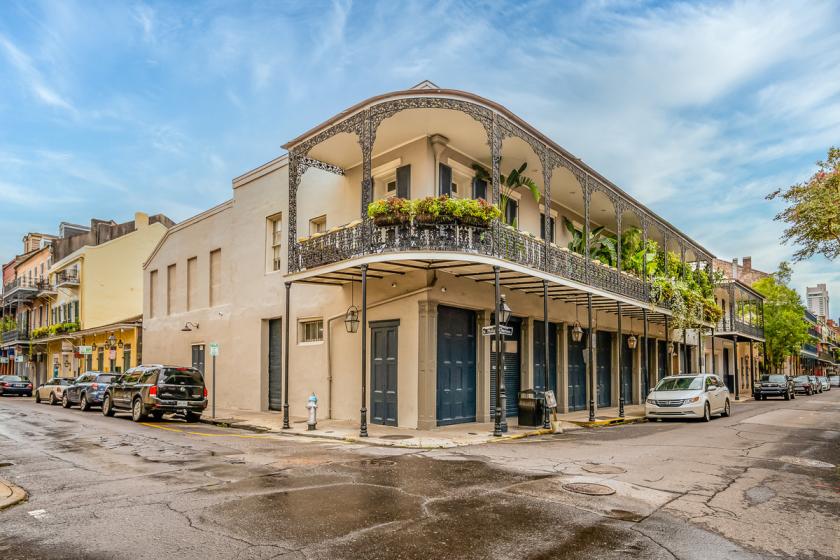
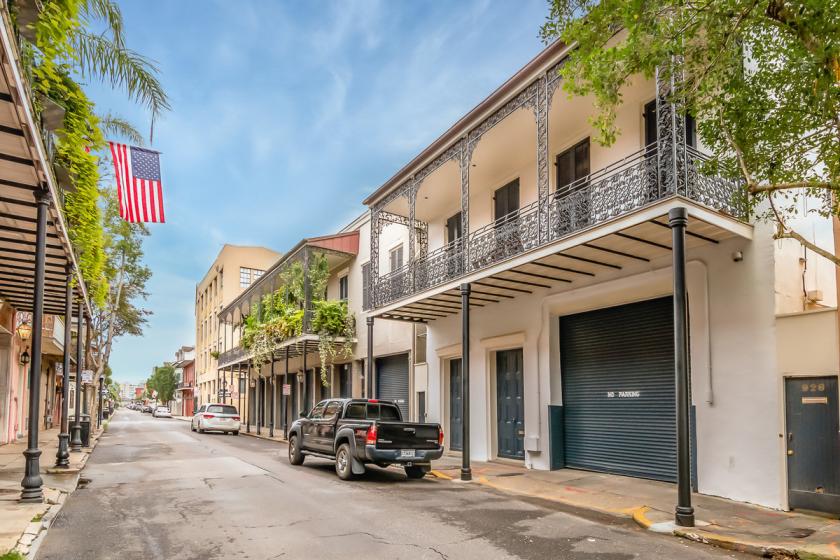
An extraordinary French Quarter opportunity! The original row of five circa 1860 two-story buildings at 930-40 Chartres Street is combined with the adjacent circa 1835 two-story building at 926-28 Chartres Street to form a French Quarter developer’s dream.
The first floor is now comprised entirely of garage parking for up to 37 cars. The second floor of 926-28 Chartres has two newly renovated apartments of 1,260 SF and 1,361 SF (includes 3rd floor dormer area). The second floor of 930-40 Chartres St. has an expansive 4,150 SF owner’s unit and a separate 1,192 SF rental apartment with an 1,180 SF outside patio. The buildings are wrapped by magnificent covered galleries with stunning views of the Vieux Carré
Existing plans have also been drafted by Williams Architects to add two additional residential apartments of 993 SF and 945 SF with an outdoor patio above the rear of the first floor parking garage at 926-28 Chartres Street. There is also an expansive existing roof deck above the 930-938 portion of the complex.
The entire property is in excellent condition. Complete renovations have just been finished to the apartments at 926-28 Chartres Street,with a new roof and new 1400 lb passenger elevator serving those units having just been installed as well.
No part of this information may be copied, reproduced, repurposed, or screen-captured for any commercial purpose without prior written authorization from MyEListing.
While we strive to provide the most accurate information, all listing information, and demographic data, is provided by third-parties. As such, MyEListing will not be responsible for the accuracy of the information. It is strongly recommended that you verify all information with the listing agent, and any relevant agencies, prior to making any decisions.
What is the asking price for 926 Chartres Street in New Orleans?
The asking price for 926 Chartres Street is $6,600,000
What is the building size of this Multifamily property in New Orleans, LA?
The size of the building/unit at 926 Chartres Street in New Orleans is 20,412 square feet
How much land does the New Orleans, LA property at 926 Chartres Street include?
926 Chartres Street in New Orleans includes 0.292 acres of land
What is the population within 1 mile of 926 Chartres Street in New Orleans?
The population within 1 mile of 926 Chartres Street New Orleans, LA 70116 is 20,631 people.
Who do I contact for questions about 926 Chartres Street?
You should contact the listing agent,
Rich Stone, for any details regarding this commercial listing.