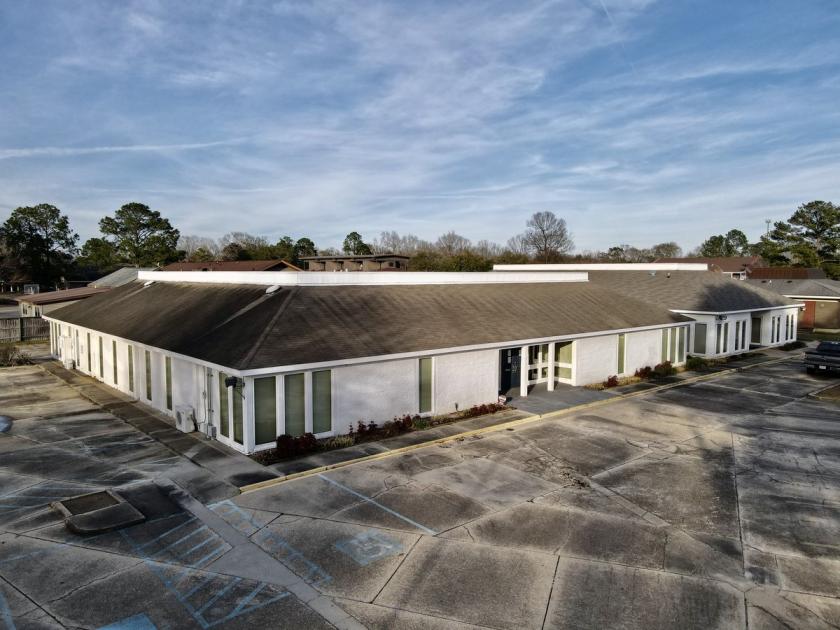
Flex-Office-Warehouse
615 Chevelle Court Baton Rouge, LA 70806
615 Chevelle Court Baton Rouge, LA 70806
Details & Description
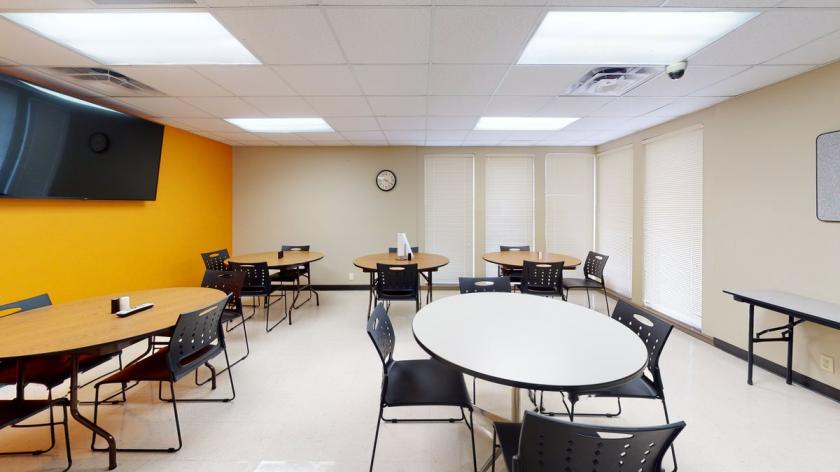
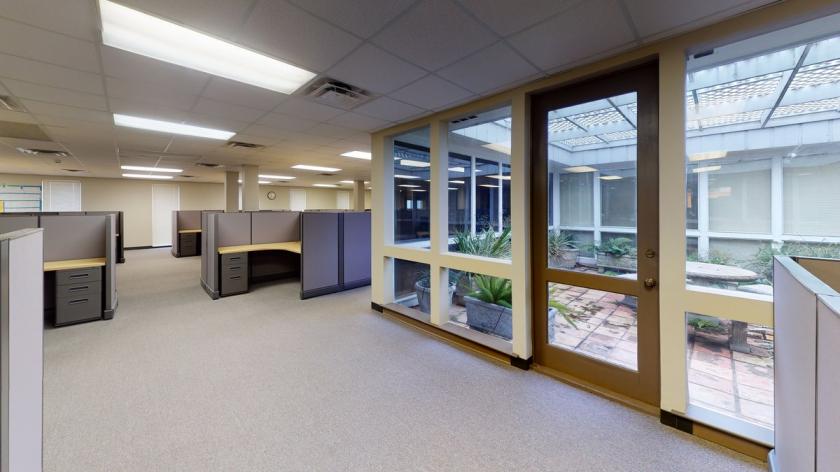
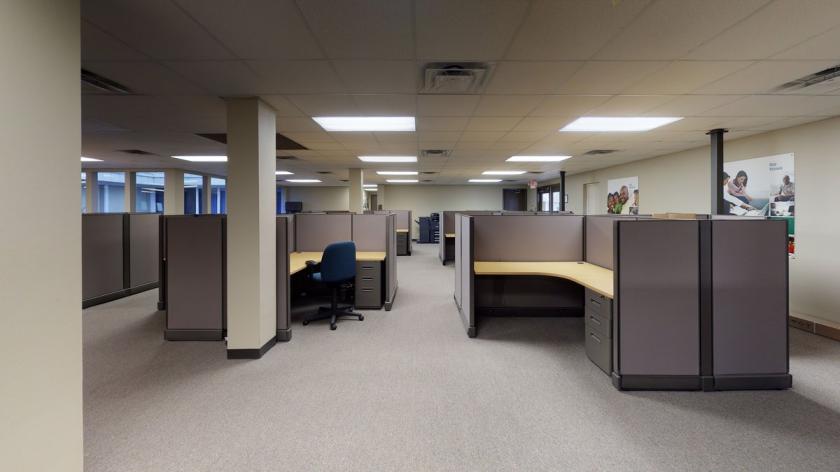
Additional Photos
Listing Agents

Ty Gose
O: 225-295-0800
ty@latterblum.com
O: 225-295-0800
ty@latterblum.com

Michael Cashio
O: 225-295-0800
M: 225-247-9812
mcashio@latterblum.com
O: 225-295-0800
M: 225-247-9812
mcashio@latterblum.com
While we strive to provide the most accurate information, all listing information, and demographic data, is provided by third-parties. As such, MyEListing will not be responsible for the accuracy of the information. It is strongly recommended that you verify all information with the listing agent, and any relevant agencies, prior to making any decisions.


